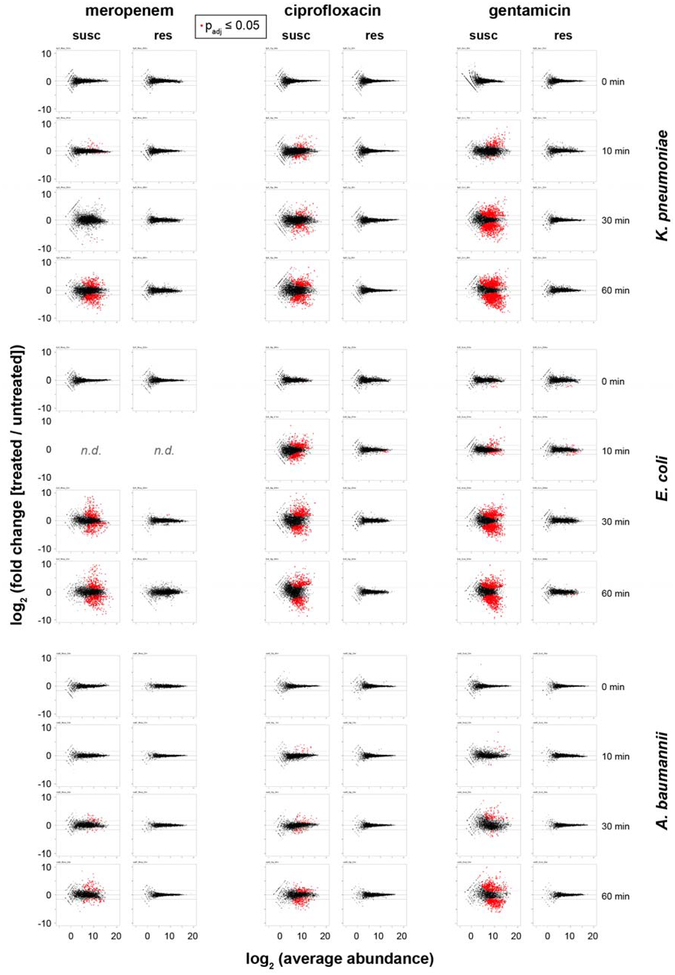
Extended Data Figure 2. Timecourse of RNA-Seq data upon antibiotic exposure reveals differential gene expression between susceptible and resistant clinical isolates.
Susceptible (left panels) or resistant (right panels) clinical isolates of K. pneumoniae, E. coli, or A. baumannii treated with meropenem, ciprofloxacin, or gentamicin at CLSI breakpoint concentrations for the indicated times. Data are presented as MA plots, Statistical significance was determined by a two-sided Wald test with the Benjamini-Hochberg correction for multiple hypothesis testing, using the DESeq2 package47.

