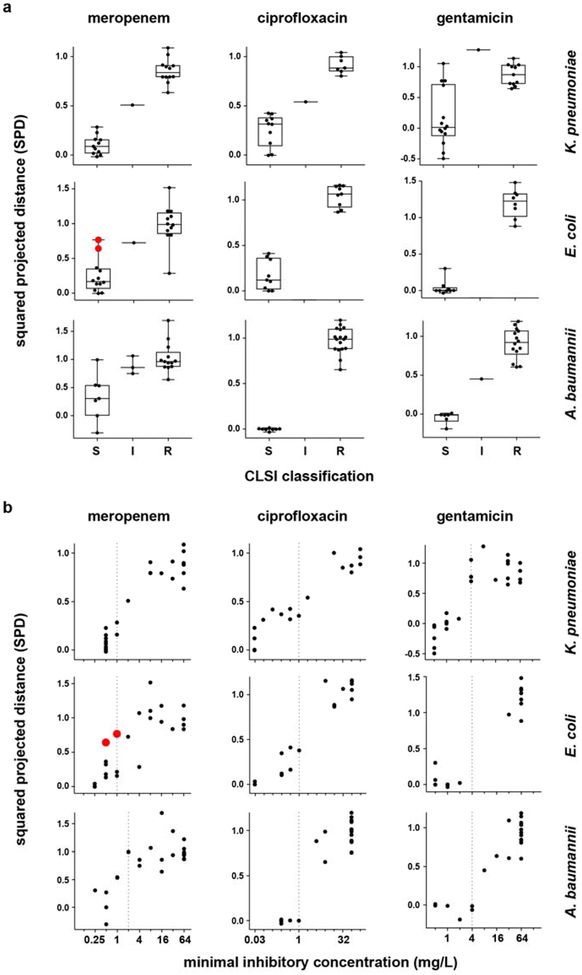
Extended Data Figure 5. One-dimensional projection of NanoString data distinguishes susceptible from resistant isolates and reflects MIC.
(a) Phase 1 NanoString data from Extended Data Fig. 2 (i.e., normalized, log-transformed fold-induction for each responsive transcript), analyzed as described to generate squared projected distance (SPD) metrics (y-axes) for each strain (see Supplemental Methods), are binned by CLSI classifications (x-axes), for clinical isolates of K. pneumoniae (24, 18, and 26 independent clinical isolates for the three antibiotics, respectively), E. coli (24 independent clinical isolates for each antibiotic), or A. baumannii (24 clinical isolates for each antibiotic) treated at CLSI breakpoint concentrations with meropenem, ciprofloxacin, or gentamicin (the same isolates shown in Fig. 1b–c and Extended Data Fig. 1b–c). By definition, an SPD of 0 indicates a transcriptional response to antibiotic equivalent to that of an average susceptible strain, while an SPD of 1 indicates a response equivalent to that of an average resistant strain. See Supplemental Methods for details. Data are summarized as box-and-whisker plots, where boxes extend from the 25th to 75th percentile for each category, with a line at the median, and whiskers extend from the minimum to the maximum. Note that for A. baumannii and meropenem, the clustering of the majority of susceptible strains by this simple metric (aside from one outlier which is misclassified as resistant by GoPhAST-R) underscores the true differences in transcription between susceptible and resistant isolates, despite the more subtle-appearing differences in heatmaps for this combination (Extended Data Fig. 1b), which is largely caused by one strain with an exaggerated transcriptional response (seen here as the strain with a markedly negative SPD) that affects scaling of the heatmap. (b) The same SPD data (y-axes) plotted against broth microdilution MICs (x-axes) reveal that the magnitude of the transcriptional response to antibiotic exposure correlates with MIC. In both (a) and (b), strains with a large inoculum effect upon meropenem treatment are displayed in red and enlarged. Vertical dashed line indicates the CLSI breakpoint between susceptible and not susceptible (i.e., intermediate or resistant).

