. 2019 Dec 24;8:e48916. doi: 10.7554/eLife.48916

Figure 1. Steps of lymph node (LN) metastatic colonization.

B6 mice were implanted with B16-GFP cancer cells in footpads. Representative laser scanning microscopy images of cryosectioned sentinel popliteal LNs (pLNs) on indicated days are shown. (A) Image taken at 14 days post-inoculation; pioneer metastatic cells (green) were evident in the subcapsular sinus (SCS) of pLN. Here, metastatic cell could be seen in close contact with Siglec1+ SCS macrophages (red) in the LN SCS lined by lymphatic endothelial cells (blue). (B) A laser scanning microscope image of early metastatic B16F10 cell (green) in close contact with LN SCS macrophages (Siglec1, red; nucleus, blue) and its 3D reconstructed image. (C) Metastatic cells resumed proliferation and formed microscopic metastatic foci within the LN SCS. (D) Metastatic foci grew and disrupted the SCS macrophage–lymphatic endothelial cell lining and entered the LN cortex. Data representative of four biologically independent experiments. (E, F) Adhesion assays of B16-GFP cells on monolayers of HEK293T or Siglec-1 expressing HEK293T cells. (E) Representative photomicrographs of adherent B16-GFP cells on the monolayer of indicated HEK293T cells. (F) Quantification of the number of adherent B16-GFP cells on monolayers. Data are ±s.d.; n = 4 biologically independent experiments. P-value was calculated by two-tailed, unpaired t-test.

Figure 1—source data 1. This spreadsheet contains the source data for Figure 1F.

Figure 1.

Figure 1—figure supplement 1. Approach for visualization of pioneer metastatic cells and early metastatic events in LNs.

Figure 1—figure supplement 1.

(A) Schema to study early metastatic B16-GFP cells in LNs. A total of 2 × 105 B16-GFP cells were implanted into the footpads of mice and sentinel pLNs were excised on different days. Then 4% formaldehyde-fixed pLNs were serially sectioned with a cryostat and observed by fluorescence microscopy to locate GFP+ cells. (B) Pioneer metastatic cells can be seen in the LN SCS at day 14. A low magnification tile scan of a whole metastatic LN showing GFP+ B16F10 melanoma cells (green) in SCS lined by Lyve1+ lymphatic endothelial cells (blue). High magnification image of the same pioneer metastasis cell in Lyve1+ sinus. A DAPI+ nucleus (white) can be seen in GFP+ metastatic melanoma cells. (C) Representative image of pioneer metastatic cells (green) in SCS stained for CD11b (SCS macrophages, red), Lyve1 (SCS lymphatic endothelial cells, blue), and DAPI (nuclei, white) to define SCS macrophage–tumor cell interactions and its 3D reconstructed image (n = 6).
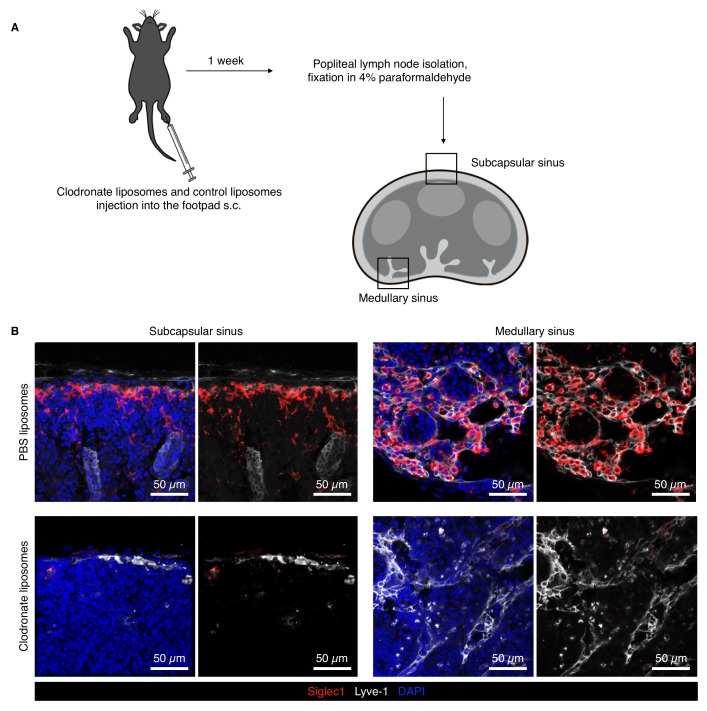
Figure 1—figure supplement 2. Siglec1 is expressed on the macrophages on the floor of the LN SCS and medullary region.

Figure 1—figure supplement 2.

(A) Schematic of the LN macrophage depletion experiment to confirm that Siglec1 was expressed on LN macrophages. (B) Confocal micrograph of popliteal LNs of PBS liposomes and animals that had received clodronate liposome footpad injection 7 days earlier. Clodronate treatment depleted the Siglec1-expressing macrophages, thus no Siglec1-positive macrophages could be seen in the SCS and medullary sinus. Note the complete absence of Siglec1 on Lyve1+ SCS and medullary lymphatic endothelial cells. Representative data from two independent experiments.
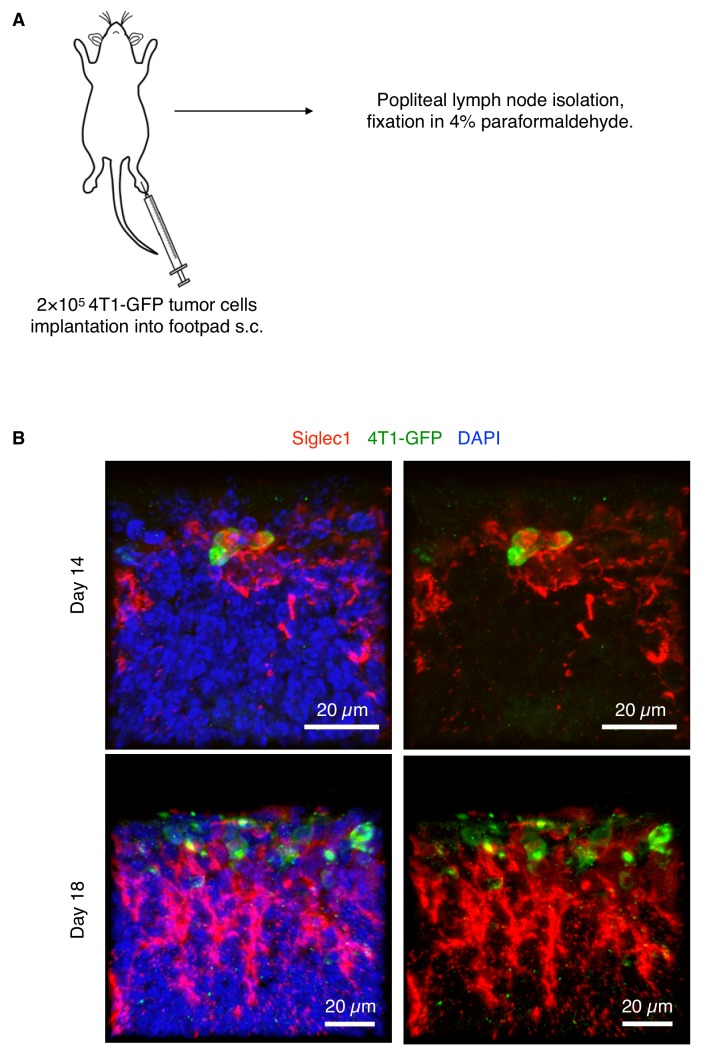
Figure 1—figure supplement 3. 4T1 mouse breast cancer cells use LN SCS macrophages to find footholds during LN metastasis.

Figure 1—figure supplement 3.

(A) Schematic of experiment. EGFP-expressing 4T1 cells were implanted into BALB/c mouse footpads and popliteal LNs were isolated from day 14 for confocal imaging. The procedure was the same as described in Figure 1—figure supplement 1A. (B) GFP+ 4T1 cells (green) can be seen in close contact with LN SCS macrophages (red) at day 14. A growing LN metastatic colony of 4T1-GFP cells can be seen at day 18 growing in close contact with SCS macrophages. GFP signals in 4T1-GFP cells were amplified using anti-GFP antibody. Representative images from two independent experiments.
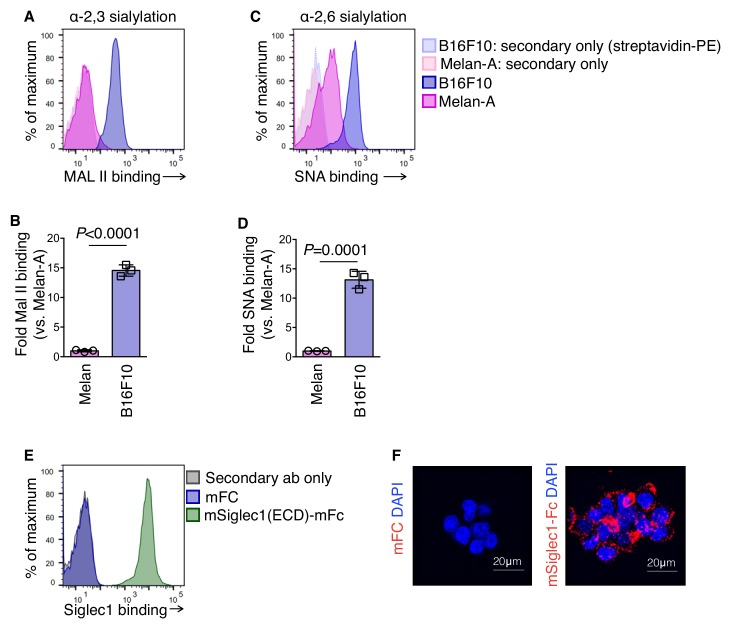
Figure 1—figure supplement 4. Siglec1 binds to hypersialylated cell surface proteins of mouse melanoma cells.

Figure 1—figure supplement 4.

(A–D) Lectin FACS staining showing hypersialylation of cell surface proteins in B16F10. Non-tumorigenic mouse melanocytes melan-A cells (pink) and mouse melanoma B16F10 cells (blue) were stained with α−2,3 sialylation-specific biotinylated Maackia amurensis lectin II (MAL II; A, B) and α−2,6 sialylation-specific biotinylated Sambucus nigra lectin (SNA; C, D), followed by detection with streptavidin-PE. Data are mean ±s.d.; n = 3 biologically independent experiments. P-value was calculated by two-tailed, unpaired t-test. (E, F) Purified recombinant mouse Siglec1(ECD)-mFC binding to B16F10 cells confirmed by FACS (E) and laser scanning confocal microscopy (F).
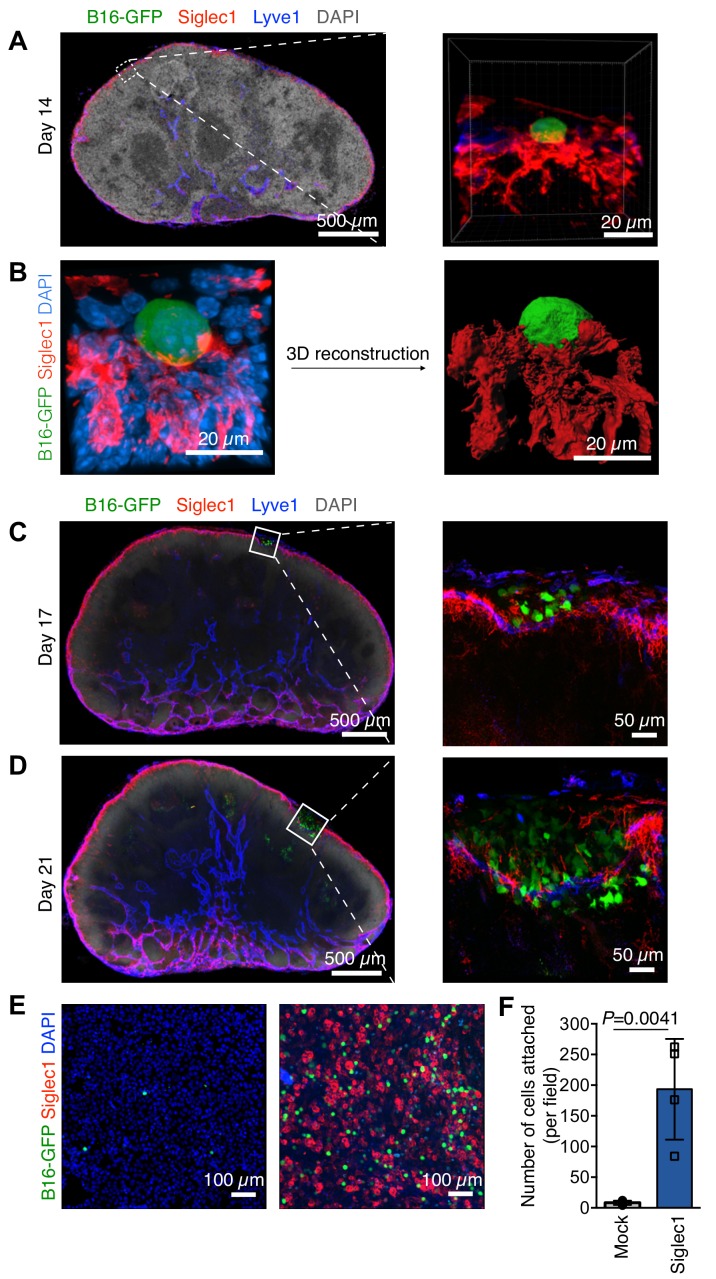
Figure 1—figure supplement 4—source data 1. This spreadsheet contains the source data for figure supplement 4.
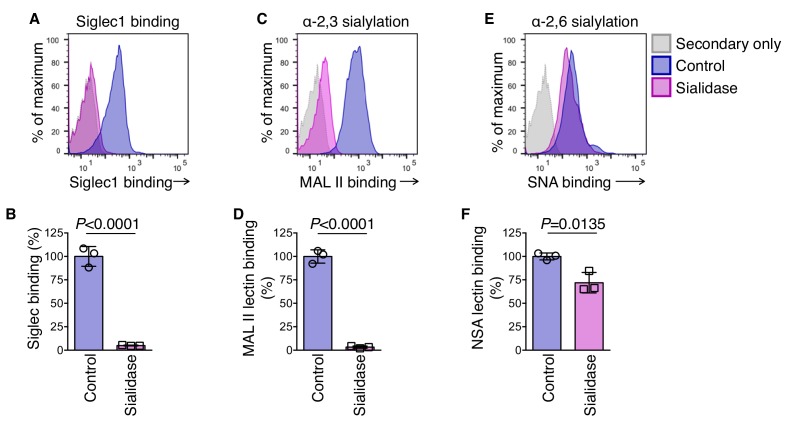
Figure 1—figure supplement 5. Siglec1 binds to mouse melanoma cells in an α−2,3 sialylation-specific manner.

Figure 1—figure supplement 5.

(A-F) Effect of sialidase treatment on cell surface binding of Siglec1 and sialylation in B16F10. Cells were treated with 0.5 U/ml sialidase in RPMI 1640 medium for 1 hr and cells were stained for mSiglec1 (A, B), MAL II (C, D), and SNA lectins (E, F). Data are mean ±s.d.; n = 3 biologically independent experiments. P-value was calculated by two-tailed, unpaired t-test.
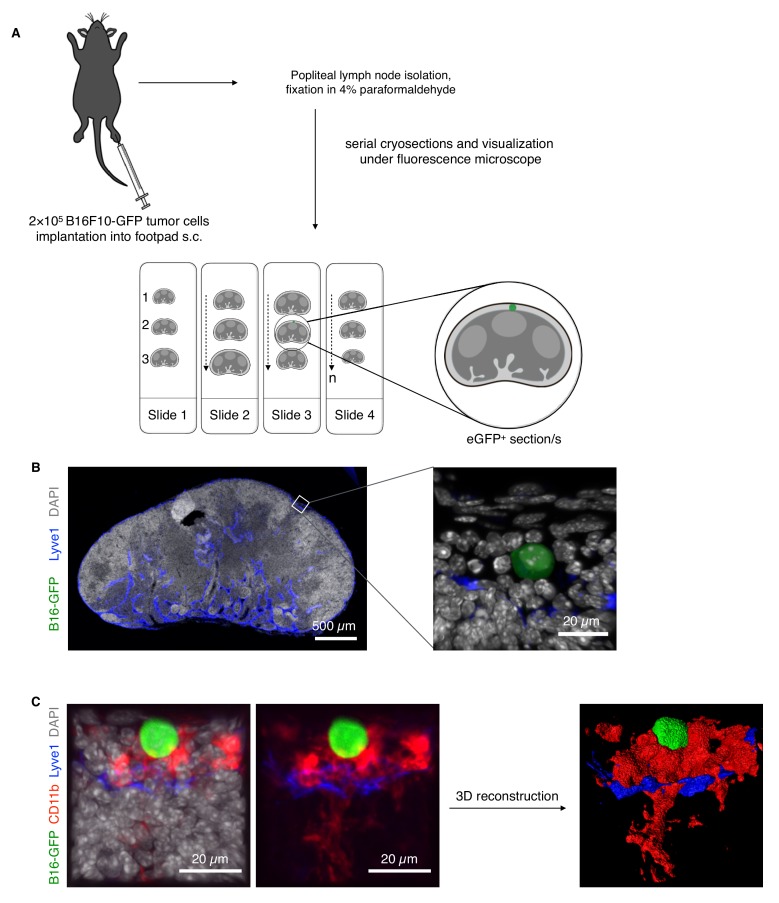
Figure 1—figure supplement 5—source data 1. This spreadsheet contains the source data for figure supplement 5.