. 2019 Dec 24;8:e48916. doi: 10.7554/eLife.48916

Figure 2. Siglec1 on SCS macrophages provides growth support to metastatic cells.

(A–D) Apoptosis (cleaved caspase-3, white; A, B) and proliferation (Ki67, white; C, D) in newly deposited metastatic cells in the LN SCS. Pioneer metastatic cells were in a non-apoptotic non-proliferative state when they landed in the SCS and resumed growth after arrest by SCS macrophages. Data representative of four biologically independent experiments. (E) Schematic of co-culture experimental procedure. HEK293T cells were transfected with empty mammalian expression plasmid or mSiglec1-expressing plasmid. Cells were cultured for 3 days before use in co-culture experiments with B16-GFP cells. (F, G) Proliferation of B16-GFP cells measured by Ki67 expression after 18 hr co-culture with HEKMock or HEKSiglec1 cells (n = 4 independent experiments, P-value by two-tailed, unpaired t-test). (H, I) Apoptosis in B16-GFP cells after 18 hr co-culture with HEKMock or HEKSiglec1 cells measured by Annexin V staining (n = 4 independent experiments, P-value by two-tailed, unpaired t-test). (J–M) Intracellular Phosflow staining to access phosphorylated AKT (pAKT; J, K) and phosphorylated ERK1/2 (pERK; L, M) levels in B16-GFP cells after 18 hr co-culture with HEKMock or HEKSiglec1 cells. Bar graphs represent fold change in phosphorylation over B16-GFP co-cultured with HEKMock (n = 3 independent experiments; P-value was calculated by two-tailed, unpaired t-test). CC3, cleaved caspase-3; meta, metastasis.

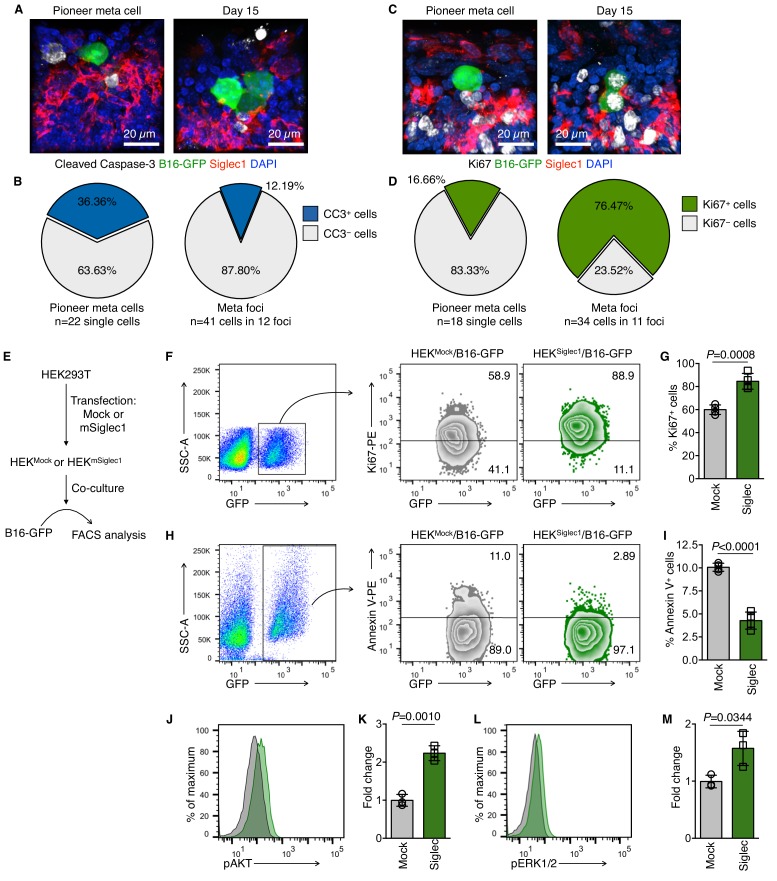
Figure 2—source data 1. This spreadsheet contains the source data for Figure 2.

Figure 2.

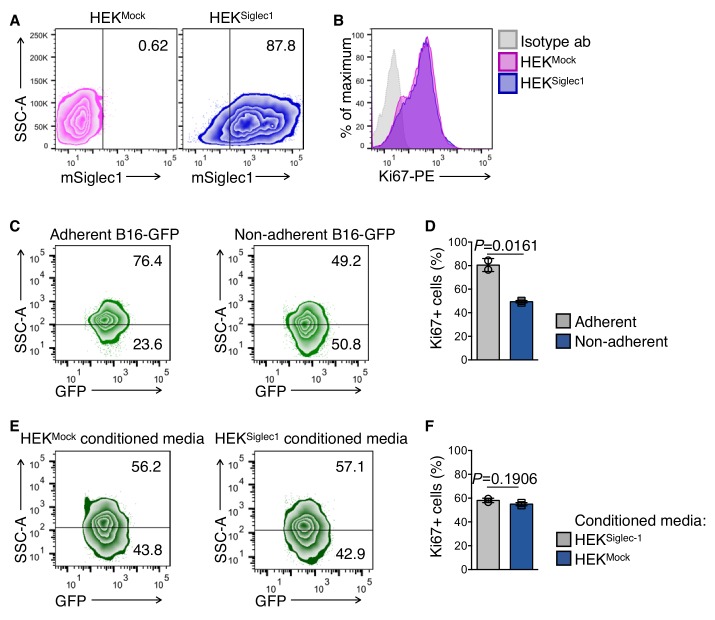
Figure 2—figure supplement 1. HEKMock and HEKSiglec1 cells.

Figure 2—figure supplement 1.

(A) HEK293T cells at 70–80% confluency were transfected with pd18 mammalian cell expression plasmid expressing full-length mouse Siglec1 cDNA; empty plasmid was used as a mock control. Cell culture medium was replaced with CDM293 (supplemented with l-glutamine) 6 hr after transfection and cells were further cultured for 3 days before assessing Siglec1 expression. (B) Ki67 levels in HEKMock and HEKSiglec1. After 3 days of culture, as described in (A), cells were fixed in Cytofix fixation buffer for 10 min at 37°C. After washing twice with PBS, cells were permeabilized in 0.1% Triton X-100 in PBS for 5 min. Cells were washed and stained with PE-conjugated anti-Ki67 and PE-conjugated isotype antibodies. (C, D) Ki67 expression in B16-GFP cells after culturing in adherent and non-adherent conditions for 18 hr. Data are mean ±s.d.; n = 2 biologically independent experiments. P-value was calculated by two-tailed, unpaired t-test. (E, F) Ki67 levels in B16-GFP cells after 18 hr incubation with conditioned media from indicated HEK cells. Media samples were collected after culturing HEKMock and HEKSiglec1 cells for 24 hr in 5% FBS-containing DMEM. After culturing B16-GFP cells in a non-adherent state with conditioned media for 18 hr, cells were fixed and stained for Ki67. Isotype antibody-stained samples were used to set cut off levels. Data are mean ±s.d.; n = 2 biologically independent experiments. P-value was calculated by two-tailed, unpaired t-test.
Figure 2—figure supplement 1—source data 1. This spreadsheet contains the source data for figure supplement 1.
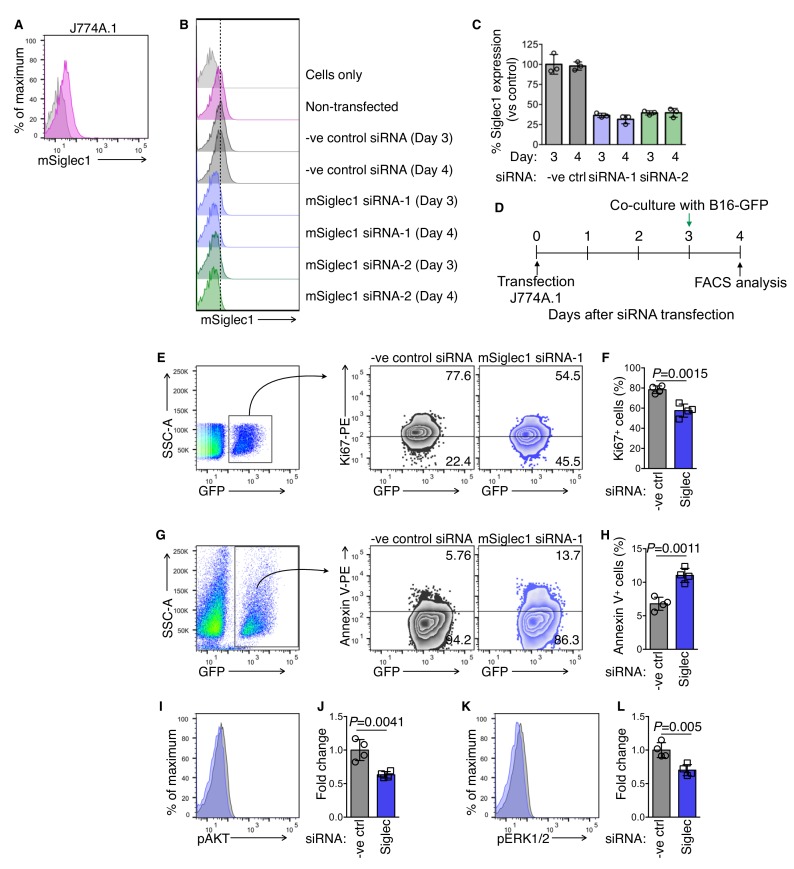
Figure 2—figure supplement 2. Knockdown of Siglec1 in J774A.1 mouse macrophages and subculture with B16-GFP cells.

Figure 2—figure supplement 2.

(A) Siglec1 expression on J774A.1 cells. (B), (C) siRNA knockdown of Siglec1. J774A.1 cells were transfected with the indicated negative control or mouse Siglec1 siRNA, and cell surface Siglec1 expression was assessed on days 3 and 4 post-transfection. Data shown in (C) are technical replicates from one experiment out of two independent experiments. (D) Schematic of siRNA transfection and co-culture experiments. (E), (F) Ki67 expression in B16-GFP cells after co-culture with control or Siglec1-knocked down J774A.1 cells (n = 4 independent experiments, P-value by two-tailed, unpaired t-test). (G, H) Apoptosis of B16-GFP cells after 18 hr co-culture with control or Siglec1-knocked down J774A.1 cells measured by Annexin V staining (n = 4 independent experiments, P-value by two-tailed, unpaired t-test). I–L Intracellular Phosflow staining to assess phosphorylated AKT (pAKT; I, J) and phosphorylated ERK1/2 (pERK; K, L) levels in B16-GFP cells after 18 hr co-culture with control or Siglec1-knocked down J774A.1 cells. (n = 4 independent experiments, P-value by two-tailed, unpaired t-test).
Figure 2—figure supplement 2—source data 1. This spreadsheet contains the source data for figure supplement 2.