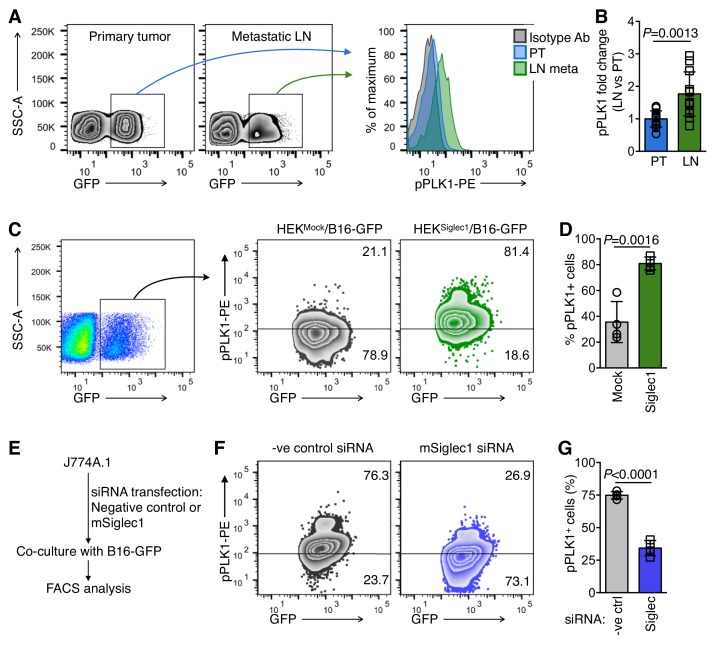
Figure 4. Siglec1-interacting cancer cells show high mitotic commitment.
(A) FACS plots showing phosphorylated PLK1 (pPLK1) in primary tumor (PT) and LN metastatic cells (LN meta). (B) Fold change in pPLK1 in LN meta vs. PT cells calculated from A (n = 12 from three independent experiments with four animals per experiment; bar represents ±s.d., P-value was calculated by two-tailed, unpaired t-test). (C, D) PLK1 phosphorylation in B16-GFP cells after 18 hr co-culture with indicated cancer cells/HEK293T co-culture. Representative FACS plot (C) and quantification (D) are shown (n = 4 independent experiments). (E) Schema of siRNA transfection in J774A.1 mouse macrophage cells and co-culture with B16-GFP cells. (F, G) PLK1 phosphorylation in B16-GFP cells after 18 hr co-culture with Siglec1-knocked down and control J774A.1 cells.( G) Quantification of (F) (n = 4 independent experiments, P-value was calculated by two-tailed, unpaired t-test).

