Figure 1. Structure of the E. gracilis ATP synthase dimer.
(A) Atomic model of the complete E. gracilis ATP synthase dimer with both subcomplexes in rotational state-1. The 2-MDa dimeric F1Fo-complex contains 29 different proteins. Dashed lines indicate C2-symmetry axis and 45° dimer angle. (B) OSCP/F1/c-ring subcomplex in rotational state-1, bound to its natural inhibitor protein IF1 (cyan), remaining Fo transparent. (C) Density map showing the lumen-exposed Fo region. Detergent belt shown in yellow; c-ring β-barrel in dark grey, Fo subunits as in (A). (D) Close-up of the lumenal interface of ATPEG1 (blue) with the c-ring (grey). The interaction occurs mostly via hydrophobic interactions (blue and grey sticks). (E–G) Euglenozoa-specific Fo-subunits with known folds. (E) ATPTB1 in blue superposed with Mdm38 (PDB ID: 3SKQ) (Lupo et al., 2011), six conserved helices coloured yellow, rest grey. (F) ATPTB3 in blue superposed with a bacterial homoisocitrate dehydrogenase in orange (PDB ID: 4YB4)(Takahashi et al., 2016), adopts a Rossman-fold. (G) ATPEG5 in yellow is a structurally conserved ortholog of the cytochrome c oxidase subunit VIb superfamily; bovine subunit VIb in purple (PDB ID: 2Y69) (Kaila et al., 2011).
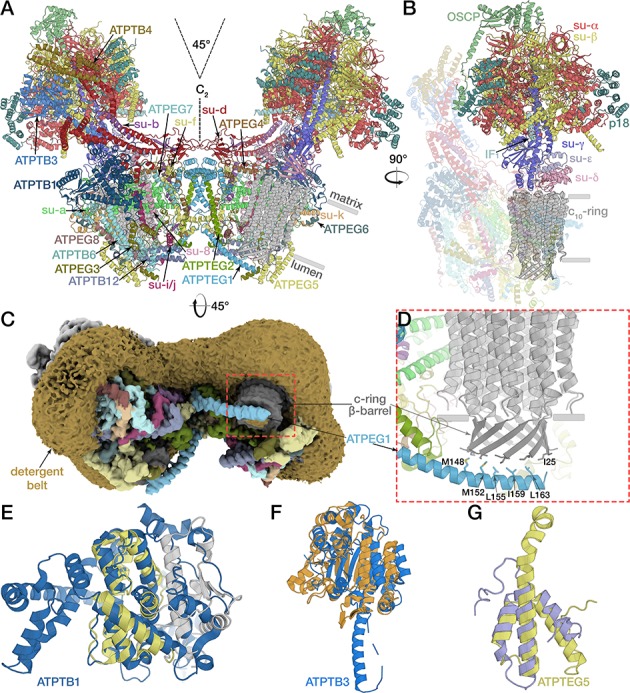
Figure 1—figure supplement 1. Cryo-EM data processing and classification scheme.
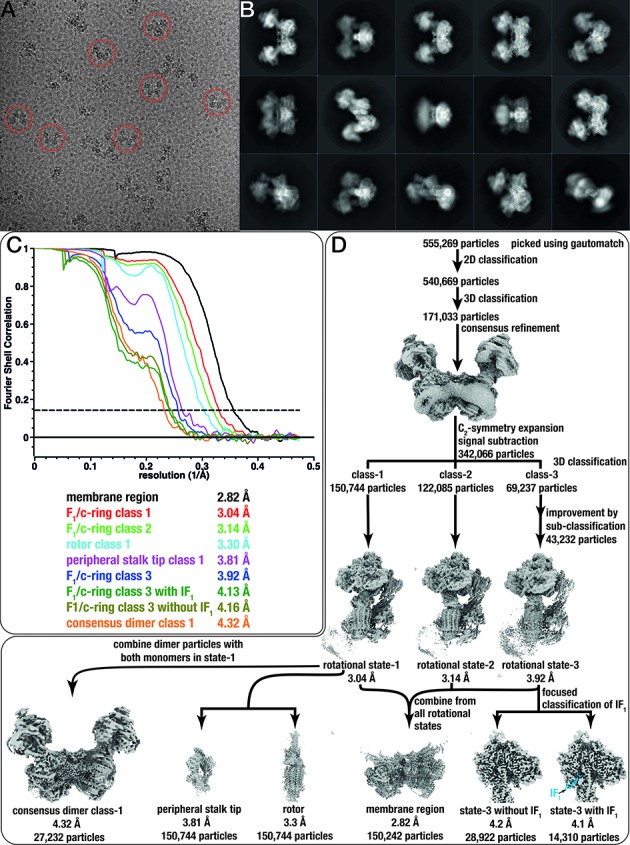
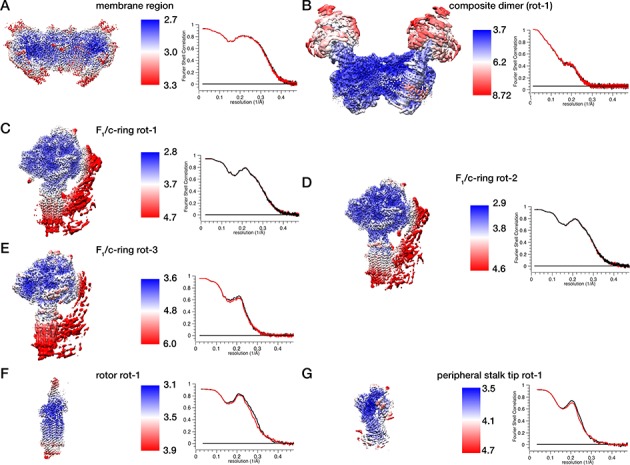
Figure 1—figure supplement 2. Local resolution estimation and model-map-correlations.