. 2019 Dec 24;8:e52220. doi: 10.7554/eLife.52220

Figure 2. Validation of the LoKI platform.

(A) Schematic of a centrosome-directed LoKI platform. SNAP-PACT fusion proteins conjugate CLP-linked Plk1 inhibitors at centrosomes. Inset depicts BI2536 in the ATP-binding pocket of Plk1. (B) Chemical structure of CLP-BI2536. (C) Dose-response curve of in vitro Plk1 inhibition with CLP-BI2536. (D) Structured illumination microscopy (SIM) of a LoKI-on U2OS cell labeled with CLP-fluorescein. Immunofluorescent detection of α-tubulin (green), DNA (blue), mCherry-SNAP-PACT (magenta) and CLP-fluorescein (yellow). Magnification of SNAP and CLP-fluorescein co-distribution at a centrosome (inset). (E) SIM micrographs of LoKI-off (left) and LoKI-on (right) U2OS cells. SNAP expression (top, magenta), CLP-fluorescein conjugation (mid, yellow) and composite images (bottom) are depicted. (F) Pulse-chase experiments measuring CLP-BI2536’s ability to block CLP-rhodamine conjugation to LoKI-on. In-gel rhodamine fluorescence (top), immunoblot of SNAP loading controls (mid), and fluorescence quantification of pulse-chase experiments (bottom). (G, H) Immunofluorescence of representative mitotic LoKI-off (G) and LoKI-on (H) U2OS cells treated with DMSO or 250 nM CLP-BI2536 for 4 hr. Composite images (left) show α-tubulin (green), DNA (blue), and SNAP (magenta). Immunofluorescent detection of pT210-Plk1 (mid, gray) as an index of kinase activity. 5X magnification of centrosomal pT210-Plk1 signals and surface plots measuring integrated intensity of pT210-Plk1 signal (insets). (I, J) Quantification of centrosomal pT210-Plk1 immunofluorescence for LoKI-expressing cells. Points represent individual cells (n). Data normalized to DMSO. Application of DMSO or CLP-BI2536 for 4 hr, (I) 100 nM, LoKI-off, n = 46, LoKI-on, n = 59, **p=0.0059; 250 nM, LoKI-off, n = 46, LoKI-on, n = 46, ****p<0.0001 and drug treatment followed by 1 hr washout (J) 250 nM, LoKI-off, n = 24, LoKI-on, n = 42, ****p<0.0001. Experiments were conducted at least three times (N = 3) and P values were calculated by unpaired two-tailed Student’s t-test. Data are mean ± s.e.m. NS, not significant. Source files for analysis of pulse-chase experiments are available in Figure 2—source data 1 and for quantification of pT210-Plk1 are available in Figure 2—source data 2.

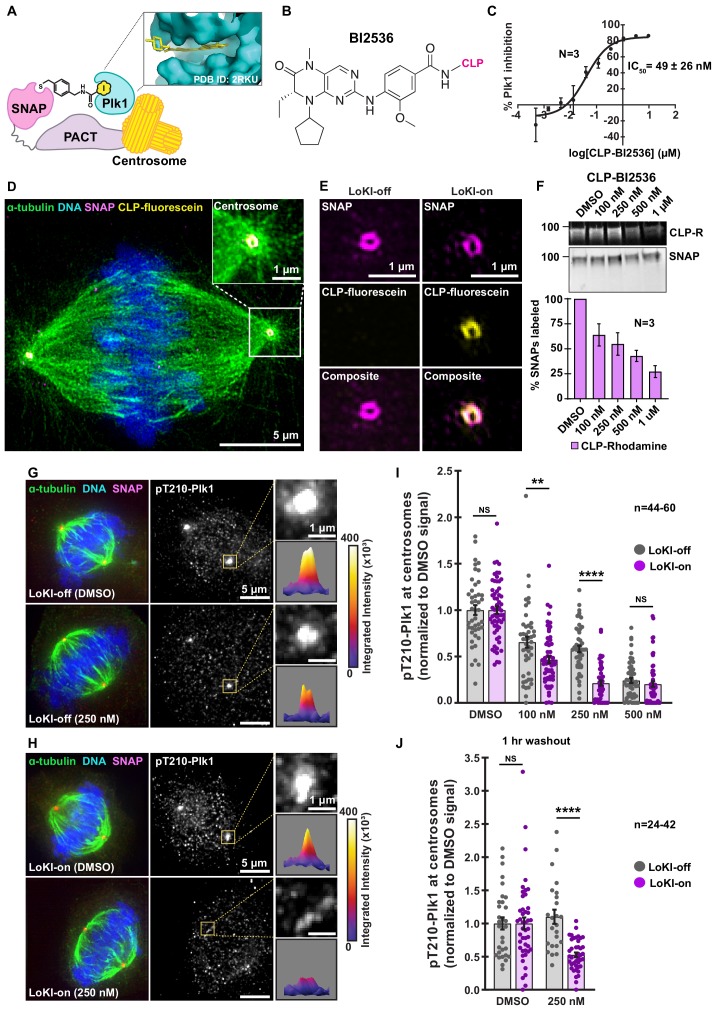
Figure 2—source data 1. Analysis for pulse-chase experiments with CLP-BI2536 in SNAP-PACT cells.
Figure 2—source data 2. Raw analysis for pT210-Plk1 signal.

Figure 2.

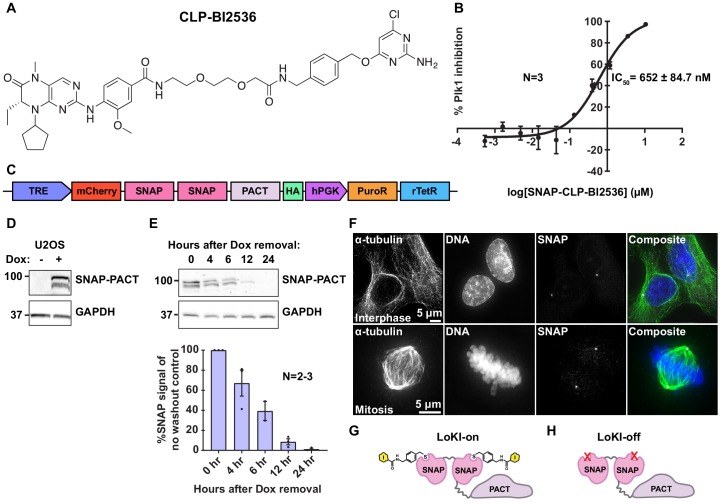
Figure 2—figure supplement 1. Validation of the LoKI system.

Figure 2—figure supplement 1.

(A) Full chemical structure of CLP-BI2536. (B) Dose-response curve depicting in vitro Plk1 inhibition with increasing concentrations of CLP-BI2536 conjugated to purified SNAP. (C) Schematic of LoKI viral construct with mCherry-SNAP-PACT under control of a doxycycline-inducible promoter. (D) Immunoblot confirming SNAP-PACT (top) expression after induction with doxycycline for 72 hr and GAPDH loading controls (bottom). (E) Immunoblot of SNAP-PACT (top) expression at selected time points after removal of doxycycline and GAPDH loading controls (bottom). Quantification of amalgamated data is presented below. (F) Immunofluorescent detection of interphase (top) and mitotic (bottom) U2OS cells showing α-tubulin (left and green), DNA (mid and blue), and SNAP (right and magenta). (G, H) Diagram of centrosomal LoKI-on (G) platform with drugs conjugated and LoKI-off (H) platform containing a mutation that occludes CLP binding. Experiments were conducted at least two times (N = 2–3). Data are mean ± s.e.m.
Figure 2—figure supplement 2. Conjugation of CLP-BI2536 to LoKI-on.

Figure 2—figure supplement 2.

(A, B) Pulse-chase experiments carried out in U2OS cells after 1 hr (A) or 2 hr (B) treatment with CLP-BI2536. In-gel rhodamine fluorescence (top), immunoblot of SNAP loading controls (mid), and fluorescence quantification of pulse-chase experiments (bottom). Experiments were conducted at least three times (N = 3). Data are mean ± s.e.m. Source files for analysis of pulse-chase experiments are available in Figure 2—figure supplement 2—source data 1.
Figure 2—figure supplement 2—source data 1. Analysis for pulse-chase time course experiments with CLP-BI2536 in SNAP-PACT cells.
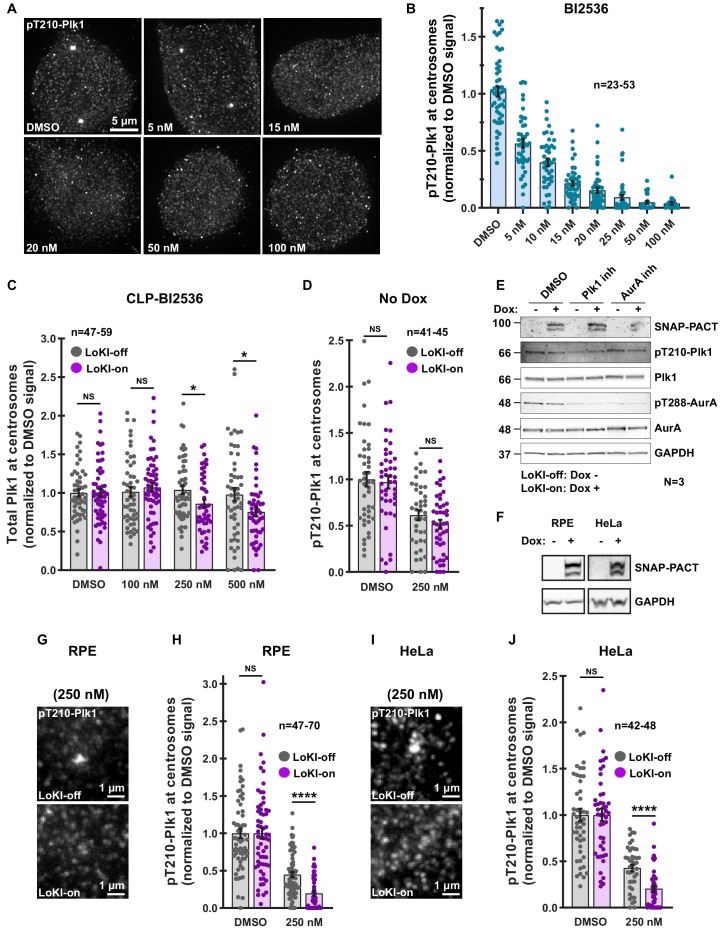
Figure 2—figure supplement 3. Characterization of Plk1 inhibition with CLP-BI2536.

Figure 2—figure supplement 3.

(A) Immunofluorescence detection of pT210-Plk1 as an index of kinase activity in parental U2OS cells treated with DMSO or unconjugated BI2536 for 4 hr. (B) Quantification of centrosomal pT210-Plk1 immunofluorescence collected from parental U2OS cells. (C) Quantification of total Plk1 immunofluorescence at centrosomes in LoKI-expressing cells after 4 hr CLP-BI2536 treatment; 250 nM, LoKI-off, n = 55, LoKI-on, n = 47, *p=0.0217; 500 nM, LoKI-off, n = 52, LoKI-on, n = 51, *p=0.0295. (D) Quantification of pT210-Plk1 immunofluorescence in control cells lacking SNAP expression (not induced with doxycycline) after 4 hr CLP-BI2536 treatment. (E) Immunoblot detection of pT210-Plk1 (blot 2) and pT288-AurA (blot 4) in LoKI-off and LoKI-on expressing cells collected via mitotic shake-off. Cells were treated for 16 hr with nocodazole and 4 hr with nocodazole plus DMSO, 250 nM CLP-BI2536, or 100 nM CLP-MLN8237. Total Plk1 (blot 3), AurA (blot 5), SNAP-PACT (blot 1), and GAPDH (blot 6) are also depicted. (F) Immunoblot confirming SNAP-PACT (top) expression after induction with doxycycline for 72 hr in RPE and HeLa cells and GAPDH loading controls (bottom). (G–J) Immunofluorescence detection of pT210-Plk1 at centrosomes in LoKI-off (top) and LoKI-on (bottom) RPE (G) and HeLa (I) cells treated with 250 nM CLP-BI2536 for 4 hr. Quantification of pT210-Plk1 immunofluorescence at centrosomes in RPE (H) 250 nM, LoKI-off, n = 70, LoKI-on, n = 47, ****p<0.0001 and HeLa (J) 250 nM, LoKI-off, n = 42, LoKI-on, n = 46, ****p<0.0001 LoKI-expressing cells after 4 hr CLP-BI2536 treatment. Points represent individual cells (n). Data normalized to DMSO. Experiments were conducted at least three times (N = 3) and P values were calculated by unpaired two-tailed Student’s t-test. Data are mean ± s.e.m. NS, not significant.
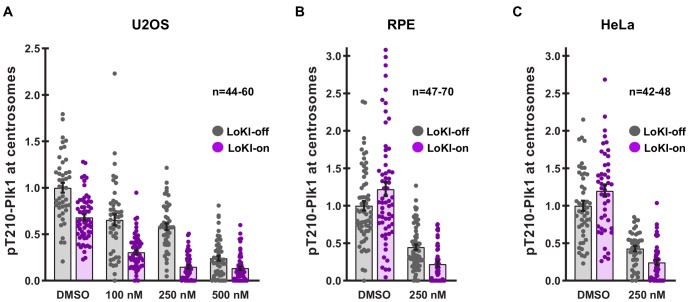
Figure 2—figure supplement 4. Non-normalized quantification of pT210-Plk1 signal at centrosomes.

Figure 2—figure supplement 4.

Quantification of non-normalized pT210-Plk1 immunofluorescence signal at centrosomes in U2OS (A) RPE (B) and HeLa (C) LoKI-expressing cells after treatment with indicated concentrations of CLP-BI2536 for 4 hr. Points represent individual cells (n). Experiments were conducted at least three times (N = 3). Data are mean ± s.e.m.
Figure 2—video 1. CLP-substrates bind SNAP in LoKI-on but not LoKI-off cells.
Download video file (21.1KB, mp4)
Reconstructed SIM 3D movie of LoKI-off (left) and LoKI-on (right) cells. Composite movies show SNAP (magenta) signal at LoKI-off centrosome while LoKI-on centrosome has an overlapping (white) signal indicating co-localization of magenta SNAP with yellow CLP-fluorescein. Related to Figure 2E.
Figure 2—video 2. CLP-substrates bind SNAP at centrosomes in LoKI-on cells.
Download video file (2.6MB, mp4)
Reconstructed structured illumination microscopy (SIM) 3D movie of LoKI-on U2OS cell with α-tubulin (green), DNA (blue), mCherry-SNAP (magenta) and CLP-fluorescein (yellow). Related to Figure 2D.