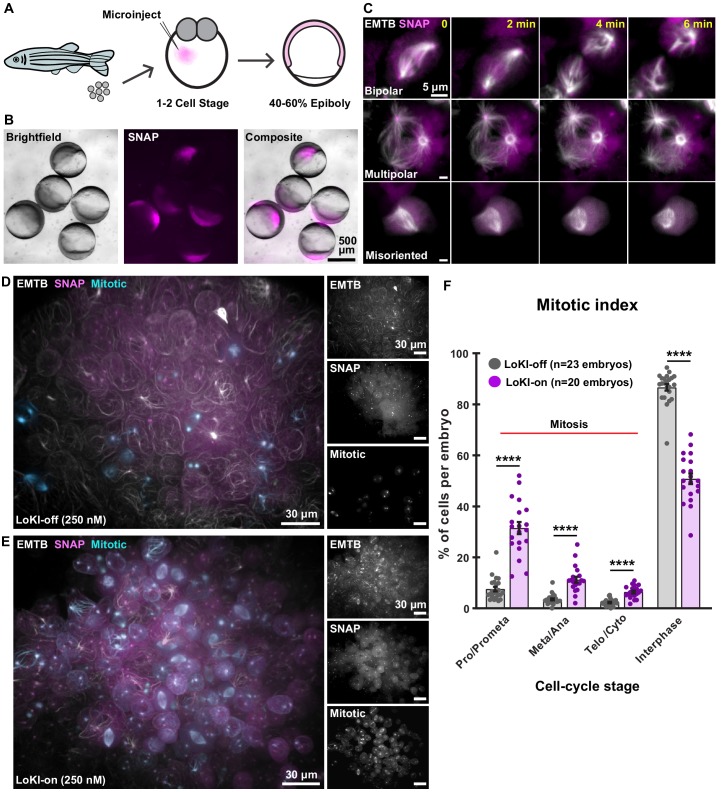
Figure 5. In vivo implementation of LoKI implicates Plk1 activity at centrosomes in coordinating mitoses during early development.
(A) Schematic of experimental scheme. Microinjection of LoKI mRNAs into zebrafish embryos occurs at the 1–2 cell stage. Live-cell imaging is conducted at ~50% epiboly. (B) Zebrafish embryos (left, brightfield) depicting regional expression of SNAP (mid, magenta) at ~50% epiboly. Composite images (right) depict expression of SNAP only in the cells of the zebrafish embryos. (C) Centrosomal delivery of Plk1 inhibitors perturb cell division in zebrafish embryos. Time-lapse images of dividing cells embedded in LoKI-on zebrafish embryos 5 hr post application of 250 nM CLP-BI2536. Representative examples of normal bipolar spindles (top) multipolar spindles (mid) and spindle orientation defects (bottom) are presented. Composite images show microtubule marker EMTB-3xGFP (white) and SNAP (magenta). (D, E) 3D-rendered images depict incidence of mitotic cells and general organization of whole LoKI-off (D) or LoKI-on (E) zebrafish embryos treated with 250 nM CLP-BI2536. EMTB (white and top inset), SNAP (magenta and mid inset), and mitotic cells (cyan and bottom inset) are shown. (F) Graph depicting mitotic index measurements for LoKI-expressing embryos; LoKI-off, n = 23, LoKI-on, n = 20, ****p<0.0001. Each point represents % of cells per individual embryo (n). Experiments were conducted at least three times (N = 3) and P values were calculated by unpaired two-tailed Student’s t-test. Data are mean ± s.e.m.


