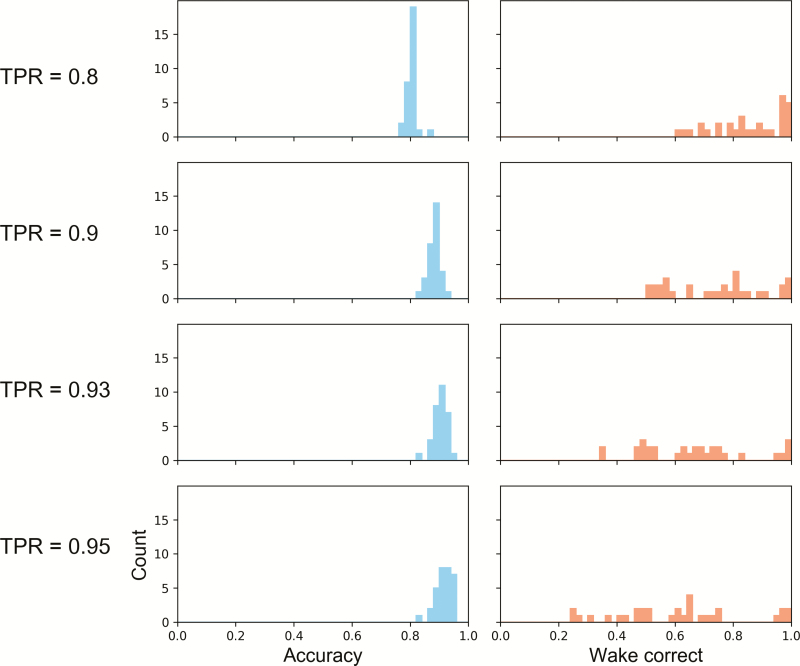
Figure 7.
Histograms of performance when training on all subjects and testing on one subject who was omitted from training. The two performance measures plotted are accuracy and specificity. Here, specificity refers to the fraction of wake epochs scored correctly as wake. Each row corresponds to a fixed “true positive rate” (TPR), referring to the fraction of sleep epochs scored correctly as sleep. For each row, the threshold separating sleep and wake was chosen to match the fixed true positive rate. As the required true positive rate increases, the likelihood of a wake epoch being scored as sleep increases; hence, there is a skew towards lower values in the specificity histograms as TPR increases.

