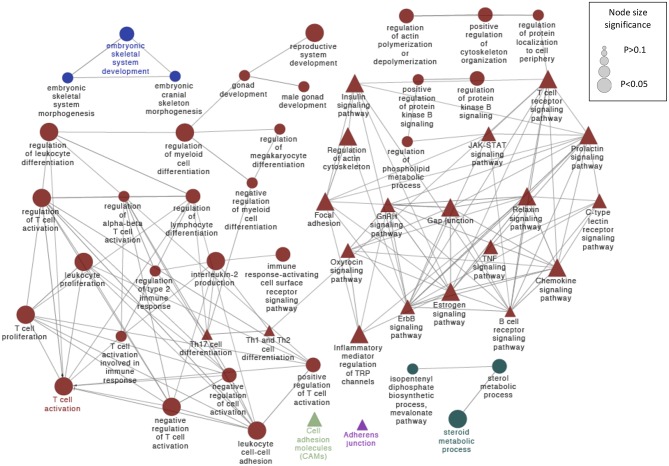
Figure 4.
Schematic representation of selected altered transcripts potentially involved in embryo kinetics in distal and proximal regions of the SP treated endometrium relative to the BTS (control) group. The analysis of overrepresented functional categories was performed using the Cytoscape v3.0.0 application ClueGo v2.0.3. The following databases were used: GO subgroup biological process shown as circles and KEGG pathways shown as triangles. Terms are functionally grouped based on shared genes (kappa score) and are shown in different colors. The sizes of the nodes indicate the degree of significance, where the biggest nodes correspond to the highest significance. The most significant term defines the name of the group. The following ClueGo parameters were used: GO tree levels, 2–5 (first level = 0); minimum number of genes, 3; minimum percentage of genes, 5; P-value correction, Benjamini-Hochberg, terms with P < 0.05, GO term fusion; GO term connection restriction (kappa score), 0.4; GO term grouping, initial group size of 2 and 50% for group merge. The resulting network was modified; that is, some redundant and non-informative terms were deleted, and the network was manually rearranged.

