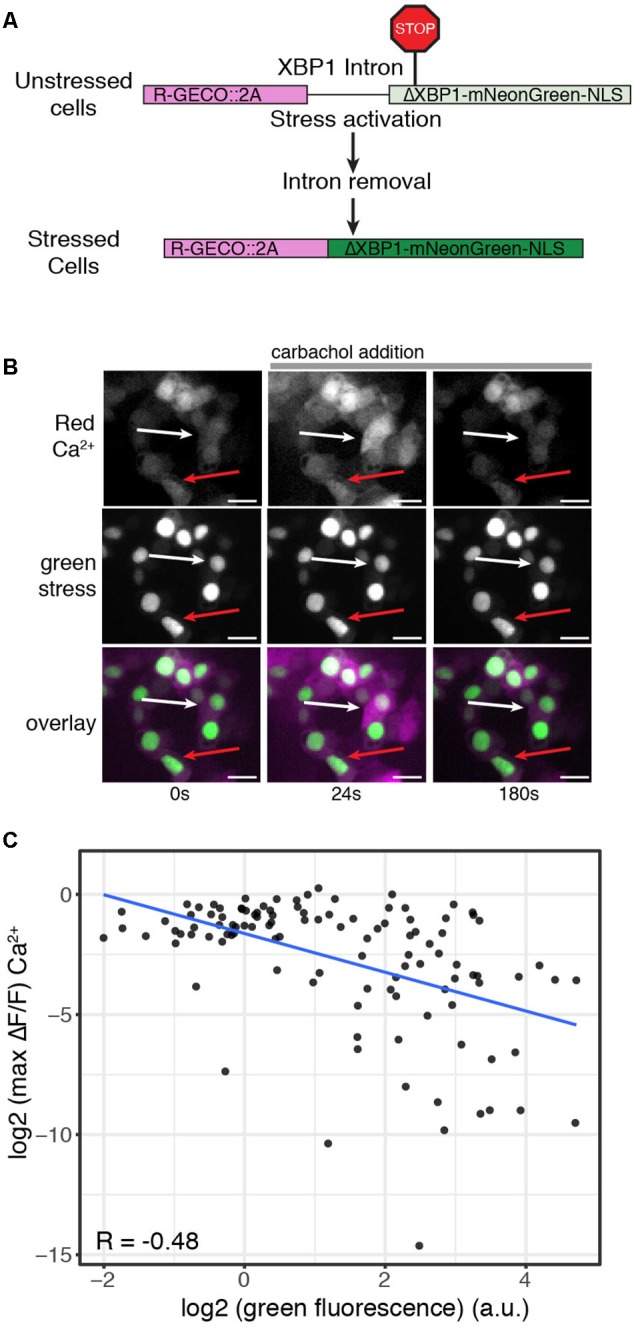
Figure 3.

ER stress levels correlate with decreased Ca2+ signaling response. (A) Schematic of the R-GECO cell stress biosensor. (B) Representative image of cells expressing the R-GECO cell stress biosensor and the rhodopsin P23H mutant. Top: red Ca2+ channel, middle: green stress channel, bottom: merge. Images are taken before during and after carbachol stimulation. The white arrow depicts a lowly stressed cell. The red arrow depicts a highly stressed cell. Scale bar = 25 μm. (C) Scatter plot comparing the stress levels and max fold change in Ca2+ levels of individual cells expressing the R-GECO cell stress biosensor and rhodopsin P23H. The blue line is the linear correlation between the two variables. R = Pearson correlation coefficient.
