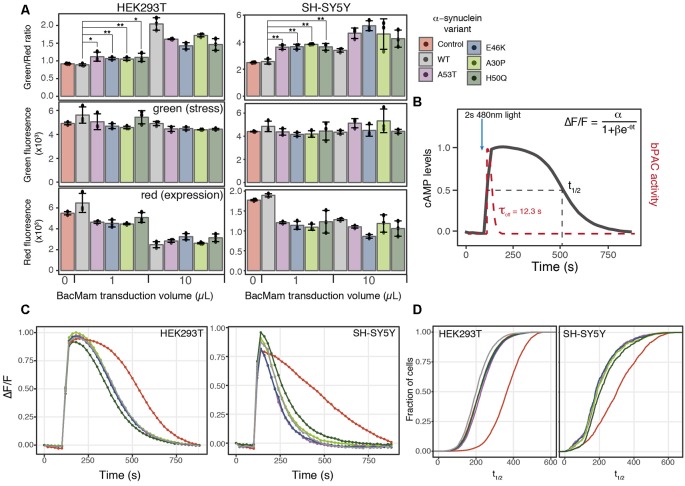
Figure 4.
α-synuclein expression induces ER-mediated cell stress and alters PDE activity. (A) HEK293T or SH-SY5Y cells were transduced with the cell stress biosensor and either no other virus (control) or 1 or 10 μl of WT α-synuclein or one of four α-synuclein mutants. The green, red, and green/red ratio fluorescence were measured after 24 h of expression. Individual data points are plotted and bars represent the mean, error bars represent the standard deviation of N = 3 wells. (B) Schematic of optical PDE activity assay. Cells were transduced with the red fluorescent cAMP biosensor R-cADDis and the blue light-activated adenylyl cyclase bPAC. Baseline cAMP levels were monitored prior to bPAC activation to raise cAMP levels. A 2-s pulse of blue light activates bPAC to raise cAMP. bPAC activity decays rapidly and cAMP levels were monitored for 15 min at which point cAMP levels return to baseline. cAMP degradation profiles were fit with the following logistic function ΔF/F = α/1+βe−θt for cAMP half-life calculation where ΔF/F is the change in fluorescence, α is the maximum cAMP level, βe−\rtheta is the exponential decay rate, and t is time in seconds. (C) Average cAMP degradation profiles in HEK293T and SH-SY5Y cells expressing different variants of α-synuclein or control cells not over-expressing any form α-synuclein. For HEK293T cells N = 3 wells per sample, control = 4,047 cells, WT = 3,882 cells, A53T = 3,385 cells, E46K = 3,431 cells, A30P = 3,700 cells, H50Q = 3,455 cells. For SH-SY5Y cells N = 3 wells per sample, control = 2,697 cells, WT = 2,427 cells, A53T = 2,775, E46K = 1,462 cells, A30P = 1,902 cells, H50Q = 2,209 cells. (D) Cumulative distribution functions plotted for the distribution of cAMP half-lives (t1/2) determined from the individual cells analyzed in (C). *P-value < 0.05, **P-value < 0.01.

