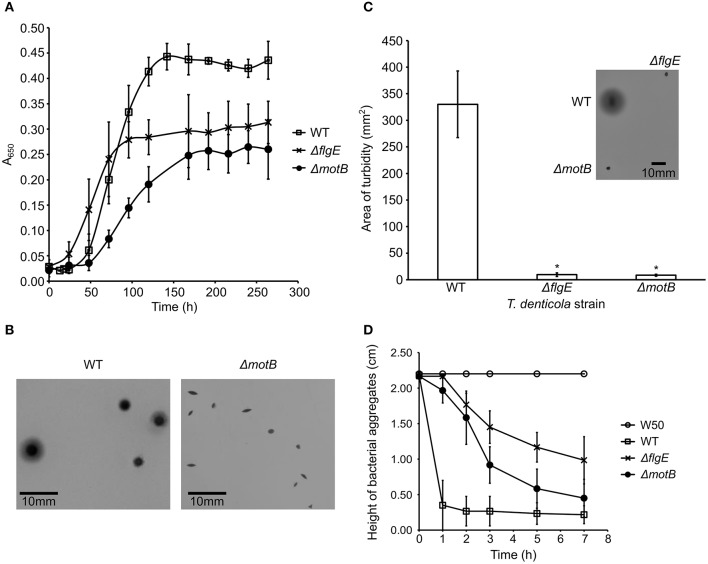
Figure 2.
Characterization of T. denticola wild-type, ΔflgE, ΔmotB. (A) Growth of T. denticola wild-type and mutants. T. denticola cultures at stationary phase were inoculated into fresh OBGM medium at t = 0. A650 of the cultures was measured at 6–24 h intervals for 264 h. The mean generation time was calculated based on the rate of change of A650 during the exponential growth phase of cultures (N = 3). The mean generation times were statistically analyzed using a one way ANOVA with both mutants ΔmotB and ΔflgE significantly different (p < 0.05) to WT. (B) Colony morphologies of T. denticola wild-type and ΔmotB. T. denticola cells were inoculated into OBGM agar [0.8% (w/v) agarose] and poured into petri dishes which were then incubated anaerobically for 2 weeks. The colonies formed by ΔflgE had a similar morphology to the colonies of ΔmotB. (C) Swimming assay of T. denticola wild-type and mutants. T. denticola cells harvested at exponential phase were spotted on semisolid OBGM agar [0.4% (w/v) agarose and 1% (w/v) gelatin] and incubated anaerobically for 10 days before the area of turbid plaque was measured. The data are presented as means plus standard deviations (N = 29) and were analyzed by Students' T-test. Values that were significantly different (p < 0.05) from the value for T. denticola wild-type are indicated by an asterisk (*). A representative image of the swimming assays of T. denticola wild-type, ΔflgE, ΔmotB after 10 days of anaerobic incubation is shown. (D) Autoaggregation of P. gingivalis W50, T. denticola wild-type and mutants. T. denticola and P. gingivalis cells harvested at exponential phase were washed twice with coaggregation buffer and adjusted to A650 of 0.5. The height of bacterial aggregates was monitored for 7 h. The data are presented as means and standard deviations (N = 3).

