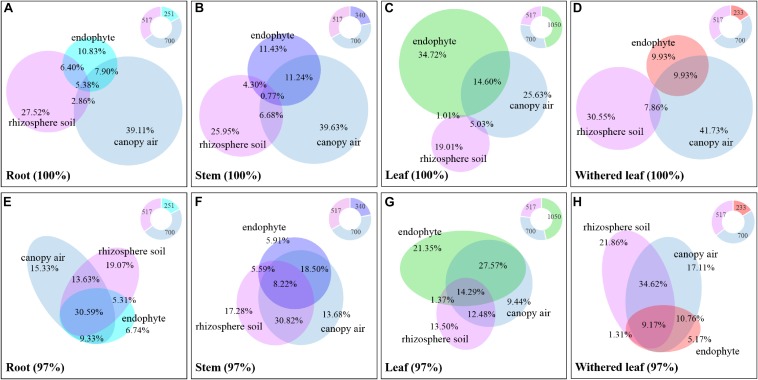
FIGURE 10.
Relative abundance of the cultivable fungi among plant tissues, canopy air, and rhizosphere soil. Panels A (unique) and E (97%) represent roots, panels B (unique) and F (97%) represent stems, panels C (unique) and G (97%) represent leaves, and panels D (unique) and H (97%) represent withered leaves. The overlapping parts of solid circles or ellipses with different colors represent the same OTUs, and the percentage is the relative abundance. The different colored parts of the ring diagrams show the abundance of cultivable endophytic fungi, rhizosphere fungi, and canopy air fungi, respectively.

