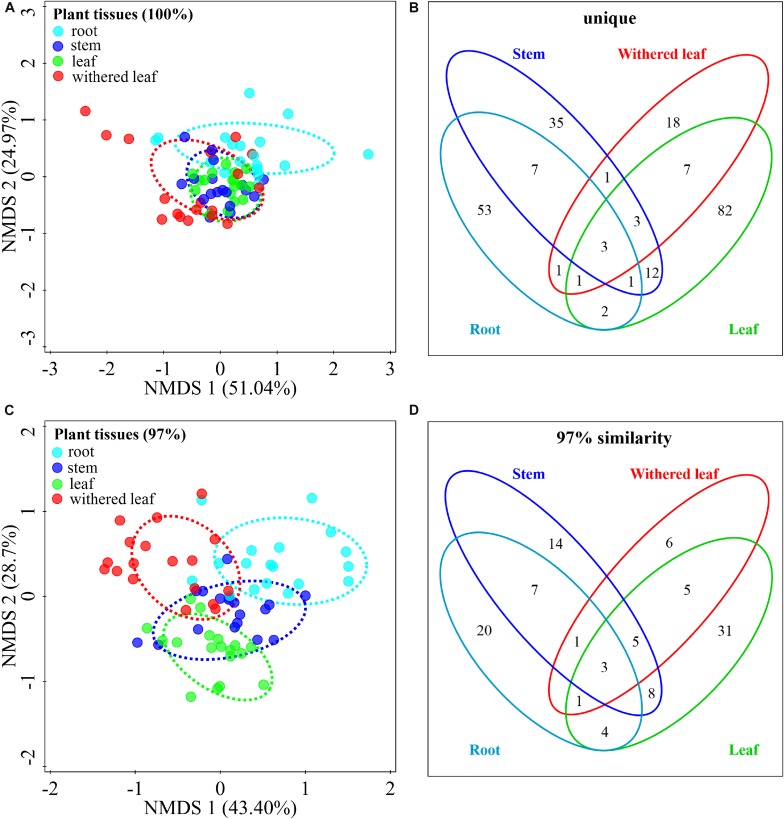
FIGURE 3.
Tissue specificity of cultivable fungal communities in A. adenophora. Non-metric multidimensional scaling (NMDS) analysis shows the similarity among cultivable fungal communities (points) [A (unique), stress = 0.083; C (97%), stress = 0.112], and the Venn diagram shows the amount of the same or different OTUs among plant tissues [B (unique), D (97%)]. Percentages of total variation explained by the NMDS axes are given in parentheses.

