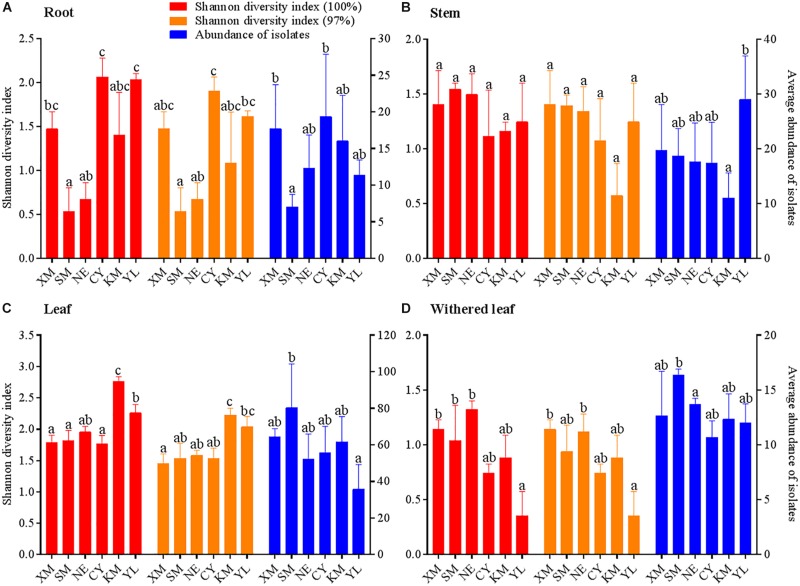
FIGURE 6.
Geographical variation in Shannon diversity index values and average abundance of cultivable fungal communities in different tissues (A, roots; B, stems; C, leaves; D, withered leaves) of A. adenophora. The Kolmogorov–Smirnov normality test was satisfied. Dunnett’s T3 test was used to compare the geographical variation in the average fungal abundance of the withered leaves, and Duncan’s test was used for all other multiple comparisons. Different lowercase letters indicate significant differences (p < 0.05). Error bars depict the standard errors.

