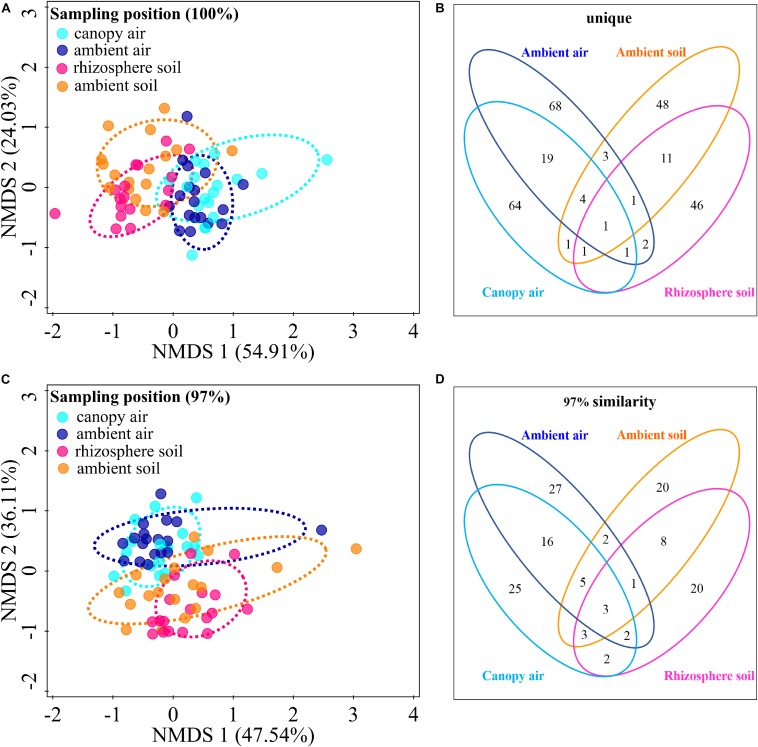
FIGURE 8.
Effects of A. adenophora invasion on the cultivable fungal communities in air and soil. Non-metric multidimensional scaling (NMDS) analysis shows the similarity among cultivable fungal communities (points) [A (unique), stress = 0.052; C (97%), stress = 0.102], and the Venn diagram shows the amount of the same or different OTUs among environment samples [B (unique), D (97%)]. There were two outlier samples [NE–RS–NS and NE–AS–MEA; NE represents the sampling site, RS (rhizosphere soil) and AS (ambient soil) represent the source, and NS and MEA represent the culture medium. See Supplementary Table S2 for details]. at the unique sequence identity level (A). To better visualize the primary data, the NMDS analysis shown in panel A does not take these two outliers into account. Percentages of total variation explained by the NMDS axes are given in parentheses.

