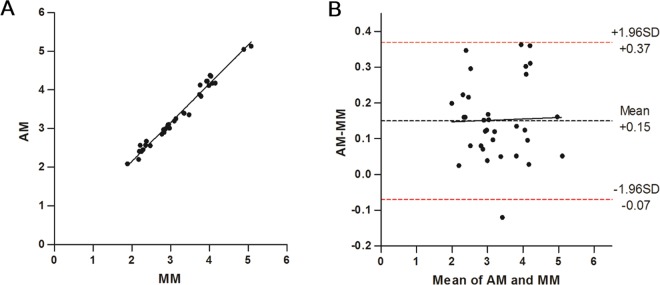
Figure 2.
Validation of calibration equation between AM and mean of five MM mEZi quantifications for a second group of 33 images. (A) AM quantifications were compensated by the regression line equation that had been established in the initial calibration study, and were then compared with the mean of five repeated MM quantifications for each image. The solid line represents the Deming regression result: AM = 1.004(MM) + 0.139, R2 = 0.991. (B) Bland-Altman plot for 33 validation images. The dashed red lines represent the 95% limits of agreement between the AM and MM (−0.07 and + 0.37).

