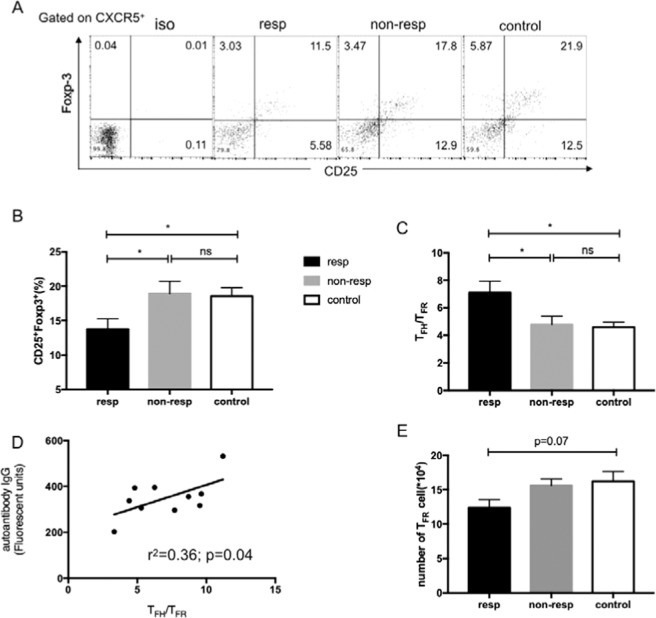
Figure 3.
Decreased TFR cells in autoantibody-positive AIHA mice. (A) The expression of CD25 and Foxp3 in CXCR5+CD4+T cells from mice in the responder, non-responder, and control groups. (B) The percentages of CD25+Foxp3+ cells in CXCR5+CD4+T cells in these three groups. (C) The ratio of TFH:TFR in these three groups. (D) Relationship of TFH:TFR and the fluorescent units of IgG-specific autoantibodies in responder the group. (E) The number of CD4+CXCR5+CD25+FoxP3+TFR cells in spleen in these three groups. Experiments were repeated three times with 3–4 mice for each group. Data shown were the mean ± SEM. *p < 0.05; ns, no significance.

