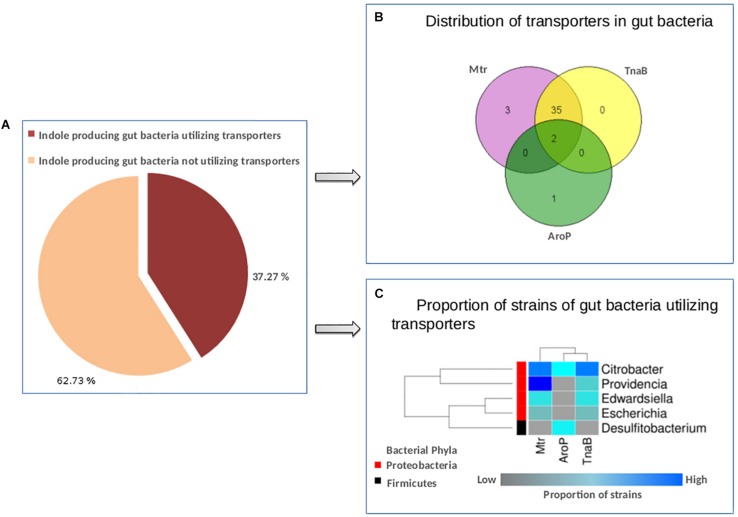
FIGURE 5.
Distribution of tryptophan transporters in gut bacteria. (A) Pie-chart depicting the proportion of indole producing gut bacteria predicted to have tryptophan transporters versus those not utilizing the same. (B) Venn diagram representing the distribution profile of three known transporters namely, TnaB, Mtr, and AroP in gut bacteria. (C) Heat-map showing the proportion of strains in each of the five gut bacterial genera predicted to utilize the three tryptophan transporters (TnaB, Mtr, and AroP).

