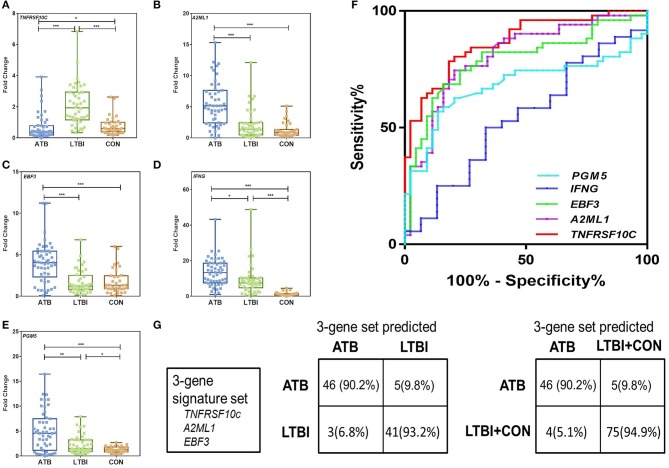
Figure 3.
Validation of differentially expressed genes between ATB and LTBI group by qRT-PCR in the Biomarker Validation Cohort. (A–E) Representative scatter plots of five discriminatively expressed genes (TNFRSF10C, IFNG, PGM5, EBF3, and A2ML1) between ATB and LTBI were shown detected by qRT-PCR. Error bars in the scatter-dot plots indicate the medians and IQRs fold change of each group following PPD stimulation. Kruskal–Wallis tests with Dunn's post tests were used to compare the differences among three groups. *Significant difference: 0.01< P < 0.05; **Significant difference: 0.001< P < 0.01; ***Significant difference: P < 0.0001. (F) The receiver operating characteristics (ROC) curves for the five genes in discriminating between ATB and LTBI group. The ROC curves were constructed using data from subjects in ATB group as patients and subjects in LTBI group as controls. (G) The diagnostic performance of the 3-gene signature set in discriminating between ATB and LTBI, and between ATB and LTBI+CON in the Biomarker Validation Cohort.

