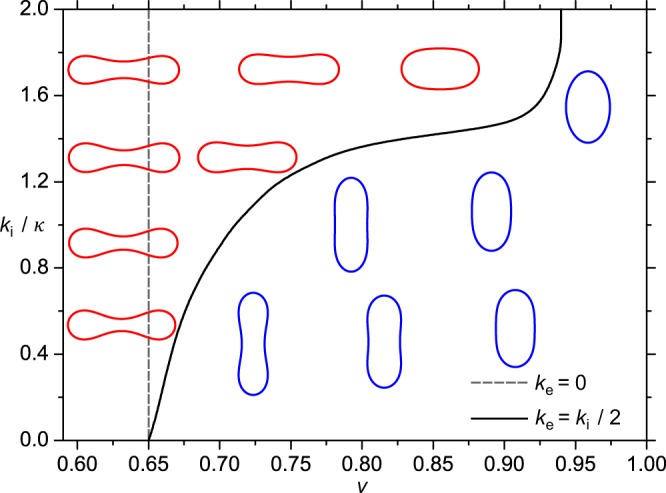
Figure 5.

Equilibrium phase diagram of nematic vesicles in either the presence or absence of the extrinsic curvature term. The solid and dashed lines separate the stability regimes of the competing structures for ke = ki/2 and ke = 0, respectively. Oblate shapes are stable on the left side and prolate shapes on the right side of these lines. Stable shapes presented in the diagram are calculated in the presence of the extrinsic term (ke = ki/2). They are shown for different values of the reduced volume v and ki/к. Prolate shapes are coloured in blue, oblate shapes (including discocyte shapes) are coloured in red R/ξ = 7.
