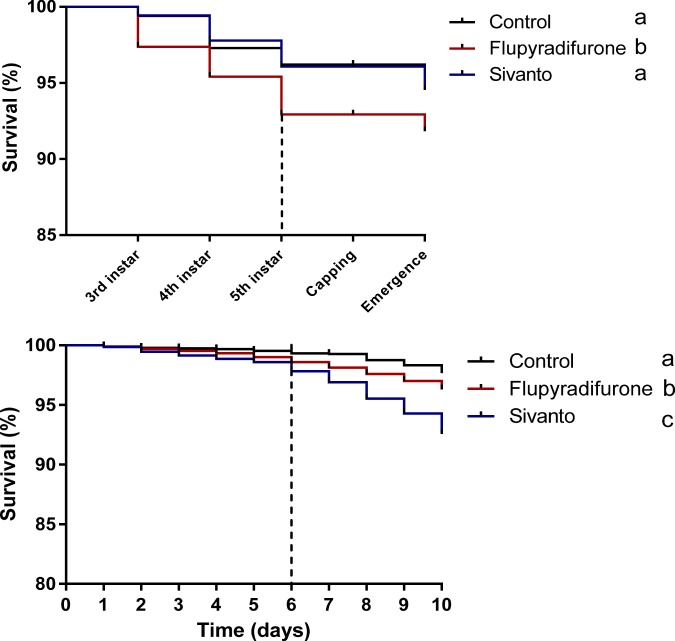
Figure 1.
Kaplan–Meier plot showing the survival of honeybee workers between the different pesticide treatments. (a) Honeybee larvae were fed with 0.025 µg of the pesticide per larvae compared to non-exposed control individuals during their early larval development. (b) Honeybee workers were fed each with 0.65 µg of the pesticide either pure or as part of an agricultural formulation (Sivanto) during their early adult stage. Letters indicate statistical differences between treatments after Bonferroni correction (log-rank (Mantel cox) paired test, p < 0.01). Dashed line indicates the end of the pesticide exposure time.

