
Figure 2.
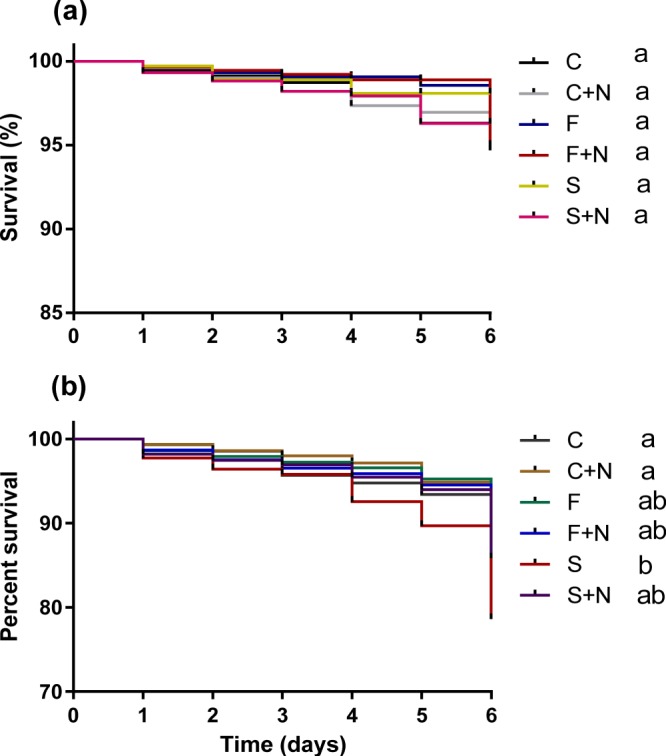
Kaplan–Meier plot showing survival of honeybee workers between the different parasite and pesticide treatments. (a) Bee larvae were exposed to 0.025 μg pesticide and infected with 10,000 N. ceranae spore per bee four days after eclosion. (b) Newly eclosed bees were fed with sublethal doses of pesticides (0.645 μg for imagos) and consequently infected with N. ceranae (10,000 spore per bee) when they were 12 days old. Different letters denote significant statistical differences between treatments (log-rank (Mantel cox) paired test, p < 0.005, after Bonferroni correction). C; control, C + N; control + N.ceranae, F; FLU, F + N; FLU + N.ceranae, S; Sivanto, S + N; Sivanto + N.ceranae.