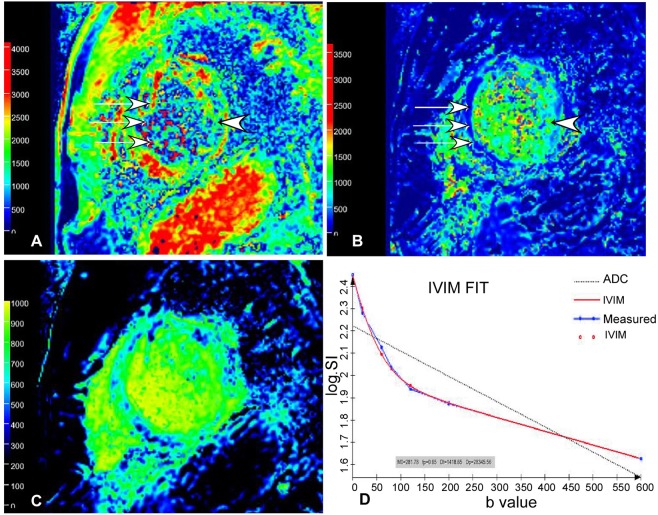
Figure 2.
Pseudo-color images of D (A), D* (B) and f (C) value in IVIM-DWI images in the same 56-year-old man as in Fig. 1. (A) The D value of the infarction (white arrows) of the interventricular septum was significantly lower than that (arrow head) of the normal lateral wall myocardium. (B) The D* value of the infarction (white arrows) of the interventricular septum was significantly greater than that (arrow head) of the normal lateral wall myocardium. (C) The f value of the infarction of the interventricular septum was significantly greater than that of the normal lateral wall myocardium. The D, D* and f values of the infarction of the interventricular septum were 0.0016 × 10⁻³ mm2/s, 0.79 × 10⁻³ mm2/s and 0.14, respectively. (D) In the fitting curves, the measured signal intensity points are distributed near the fitted curves, which reflect a higher image quality without obvious impact by respiratory movement and heart beat. Meanwhile, the dual-exponential algorithm demonstrates a better fitting effect than mono-exponential algorithm. D value, diffusion coefficient; D* value, perfusion coefficient; f value, perfusion fraction; IVIM, intravoxel incoherent motion; DWI, diffusion-weighted image.

