
Figure 1.
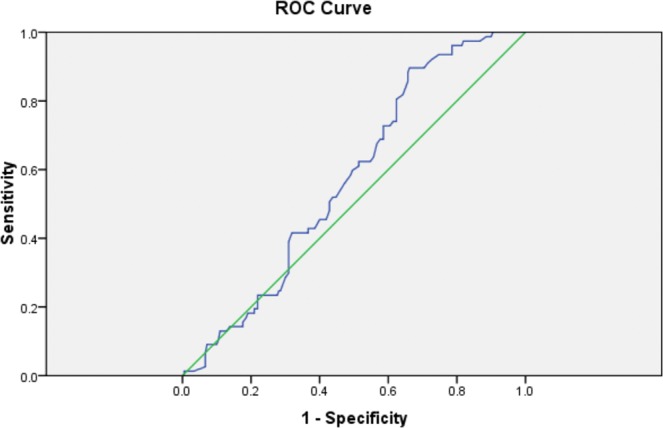
ROC curve of E Median determined by 2D-SWE in prediction of the liver fibrosis. 2D-SWE- two-dimensional shear wave elastography, E- elasticity, ROC curve- receiver operating characteristic curve.
Official websites use .gov
A
.gov website belongs to an official
government organization in the United States.
Secure .gov websites use HTTPS
A lock (
) or https:// means you've safely
connected to the .gov website. Share sensitive
information only on official, secure websites.
ROC curve of E Median determined by 2D-SWE in prediction of the liver fibrosis. 2D-SWE- two-dimensional shear wave elastography, E- elasticity, ROC curve- receiver operating characteristic curve.