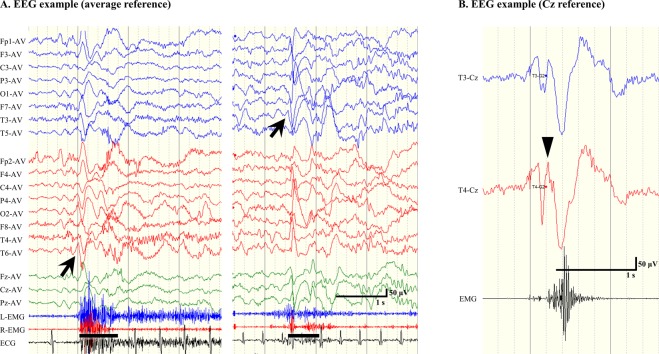
Figure 2.
Representative examples of electroencephalography (EEG) findings for epileptic spasms (ES). (A) Ictal EEGs in an average reference montage. Symmetrical ictal high-voltage slow waves (HVSs; left) and asymmetrical ictal HVSs (right). The arrows indicate the main ictal HVSs. The bars represent the durations of visually confirmed motor phenomena. (B) Ictal EEG in Cz reference montage. The main ictal HVS emerges at T4 and is thus contrasted with T3. The wedge indicates the initial negative peak.

