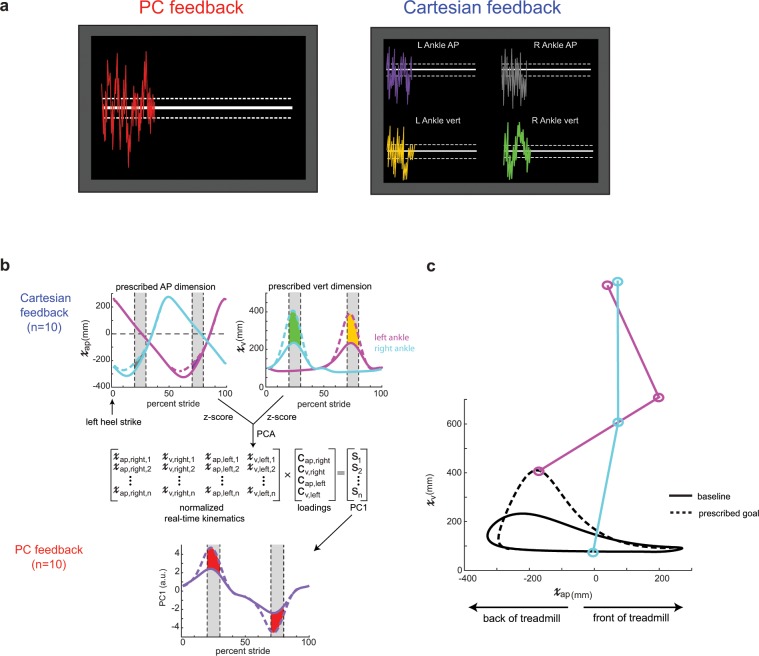
Figure 2.
(a) Visual feedback display for PC feedback and Cartesian feedback. Participants were instructed to change their walking pattern so they minimized the distance from the target line(s). PC feedback had one target line while Cartesian feedback had four target lines (one for each kinematic dimension). Dashed lines around the target line correspond to the success zone. (b) Calculation of the prescribed goal ankle kinematics. The pink trace denotes the left ankle while the cyan trace denotes the right ankle kinematics. AP and vertical dimensions were multiplied by Gaussian gains with maximum magnitudes of 0.75 and 2.5, respectively, over swing phase. Cartesian feedback displayed the difference between goal and real-time kinematics, displayed as the colored shaded regions during mid-swing on each leg. The gray shaded regions denote where this difference was averaged for visual feedback display (i.e. the rewarded time windows). We ran principal component analysis on the goal kinematics to calculate loadings. These loadings were used to calculated a goal PC1 for the PC feedback as well as a real-time PC1 using the normalized real-time kinematics. PC feedback displayed the difference between the goal and real-time PC1, displayed as the red shaded region during mid-swing on each leg. (c) Goal and baseline sagittal plane ankle kinematics for the left ankle. Participants had to take shorter, higher steps to improve performance in both dimensions. The right ankle had an identical goal pattern.

