Figure 5.
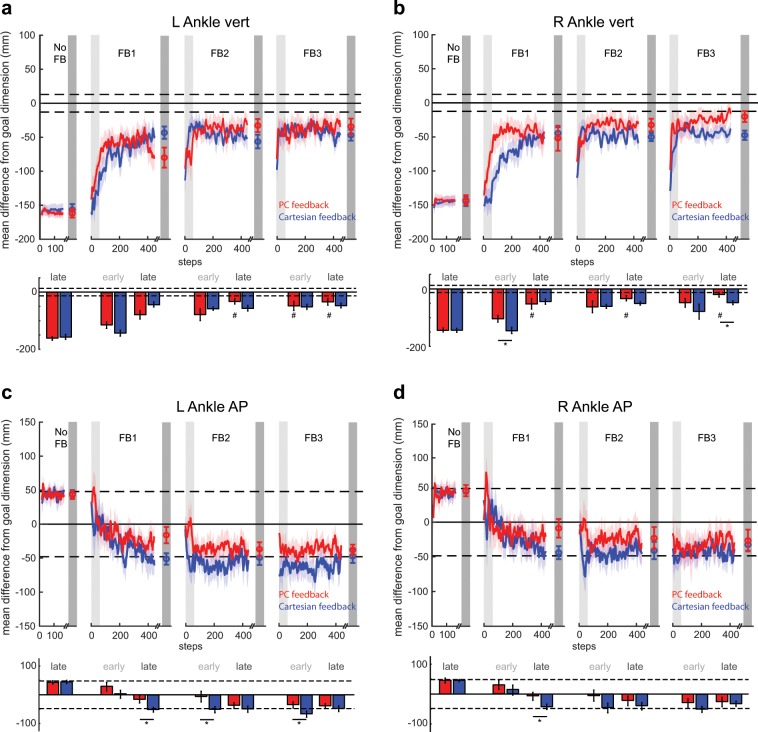
Comparison of group performance in Cartesian space. All panels show mean difference from the goal dimension for PC feedback (red traces) and Cartesian feedback (blue traces) where a value of 0 reflects perfect performance. Differences were calculated during the rewarded time windows for each step (i.e. mid-swing). Dashed lines around 0 denote the success zone for each kinematic dimension. Data points at the end of each block denote the group means ± SEM of the last 50 steps for the given block. Colored shaded regions denote standard error. Light and dark gray shaded regions denote early and late epochs consisting of the first and last 50 steps within that block, respectively. Mean performance during these early and late epochs are displayed in the bar graphs below the time series of each kinematic dimension. Data is displayed for (a) left ankle vertical dimension, (b) right ankle vertical dimension, (c) left ankle AP dimension and (d) right ankle AP dimension. *Denotes a between-subject difference (p < 0.05) for a given dimension. For the vertical dimensions, #denotes a non-significant difference (p > 0.05) between performance during a given epoch and the outer-bound of task success; determined by a paired t-test between a given participant’s outer-bound and performance during FB3 late. These are not displayed for the AP dimensions as performance is always within the success zone.

