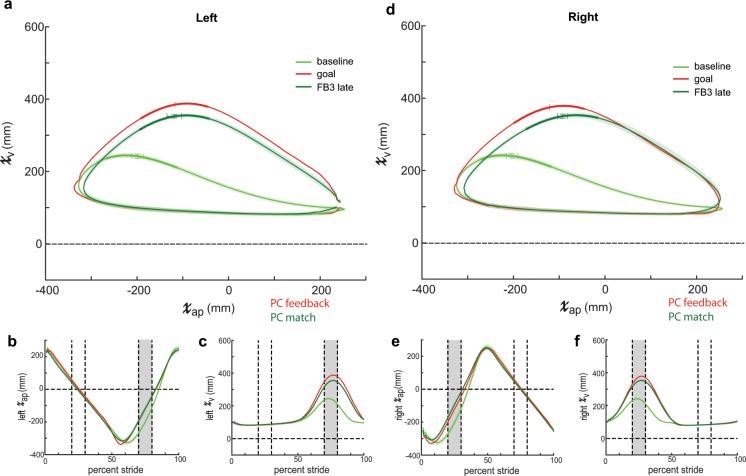
Figure 7.
Sagittal plane ankle kinematics during late training for PC match group. (a) Left sagittal plane ankle kinematics for PC match (green shades) during baseline and late training (FB3 late). Participants approach the goal kinematics (red; late training performance for PC feedback group displayed in Fig. 5) by the end of training. The bolded region on each trace denotes the kinematics during the rewarded time window. Horizontal and vertical error bars within these bolded regions correspond to SEM during mid-swing in the AP and vertical dimensions, respectively. Shaded regions around each trace denote SEM in the vertical dimension. (b) Time-series kinematics for the left ankle AP dimension. Kinematics are aligned to left heel strike (i.e. 0 percent stride). The gray shaded region corresponds to the rewarded time window during mid-swing for this dimension. (c) Time-series kinematics for the left ankle AP dimension. The gray shaded region corresponds to the rewarded time window during mid-swing for this dimension. Panels (d–f) contain the same information as (a–c) but for the right ankle.

