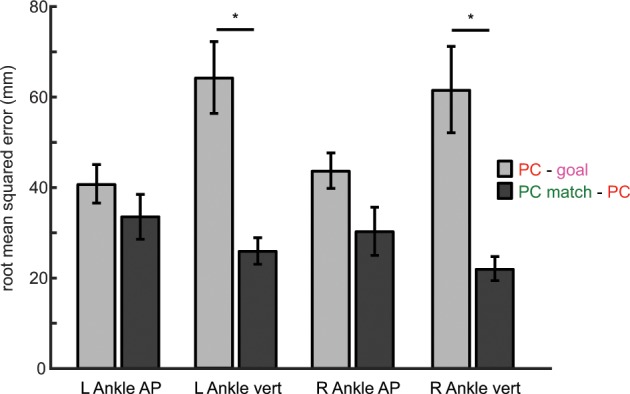
Figure 8.

Root mean-squared error between late training and goal kinematics for PC feedback (light gray) and PC match (dark gray) groups in each kinematic dimension. An error closer to a value of 0 corresponds to the participants more closely matching the goal kinematics. Color scheme in the legend corresponds to the colors of the kinematic traces displayed in Figs. 5 and 6. Error bars denotes SEM. *Denotes a between-subject difference (p < 0.05) for a given kinematic dimension.
