Figure 2.
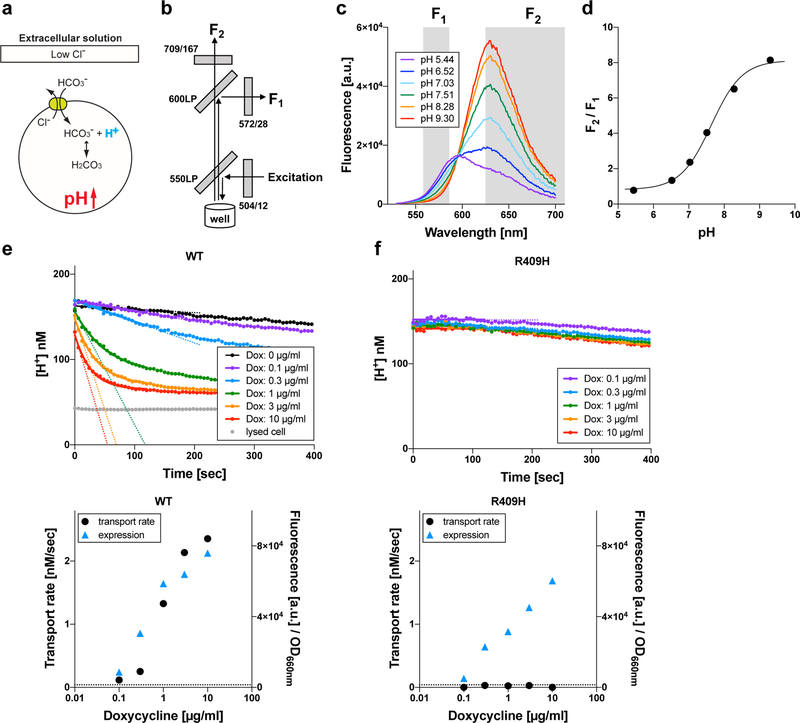
HCO3−/Cl− antiport assay. (a) Principle of the HCO3−/Cl− antiport assay. The chemical gradients of HCO3− and Cl− across the cell membrane drive exchange of these anions passively mediated by pendrin (green circle). Influx of HCO3− sucks up intracellular H+ and concomitantly increases intracellular pH, and vice versa. (b) The optical configuration of Synergy Neo2 plate reader used for the assay. Gray boxes indicate filters and dichroic mirrors (see Supp. Fig. S1 for details). (c) Response of a ratiometric fluorescence indicator, SNARF-5F, to pH. F1 and F2 are fluorescence intensities of SNARF-5F measured using two different fluorescence band-pass filters (Supp. Fig. S1). (d) The ratio of F1 and F2 (F2/F1) is plotted against pH. (e and f) Examples of HCO3−/Cl− antiport assay for WT- and p.Arg409His-pendrin-expressing cells, respectively. The broken lines indicate the initial rates (see the main text). The lower panels show summaries of the transport assay. The broken lines indicate the basal transport activity of non-induced cells (negative control). The expressions of the pendrin constructs were determined by measuring mTq2 fluorescence corrected for the density of cells (OD660nm) (blue triangles).

