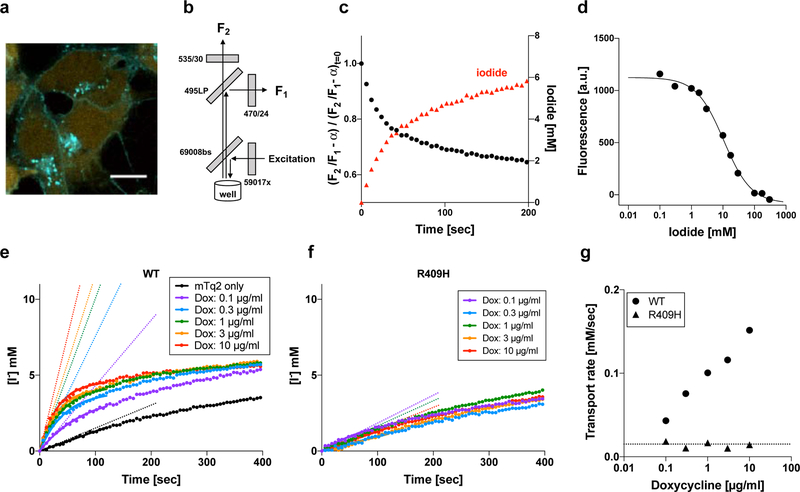
Figure 4.
I−/Cl− antiport assay. (a) A fluorescence microscopic image of cells expressing WT-pendrin-mTq2 (doxycycline-induced) and mVenus p.H148Q/p.I152L (constitutively expressed). The fluorescence of mVenus p.H148Q/p.I152L is sensitive to I−, and thus can be used as an intracellular I− indicator. (b) The optical configuration of Synergy Neo2 plate reader used for the assay. See also Supp. Fig. S1 for detail. (c) Time-dependent change of mVenus p.H148Q/p.I152L fluorescence (after correction, black circles) and intracellular iodide (red triangle). See the main text for detail. (d) Response of mVenus p.H148Q/p.I152L fluorescence to I−. The affinity of mVenus p.H148Q/p.I152L to I− was determined to be 10.6 mM. This constant was used to convert the corrected mVenus p.H148Q/p.I152L fluorescence into intracellular I− concentration. (e and f) I−/Cl− antiport assays for WT- and p.Arg409His-pendrin-expressing cells, respectively. The broken lines indicate the initial rates. (g) Summaries of doxycycline dosage-dependent I−/Cl− antiport assay shown in panels e and f. The broken lines indicate the basal transport activity determined for non-induced cells (negative control).

