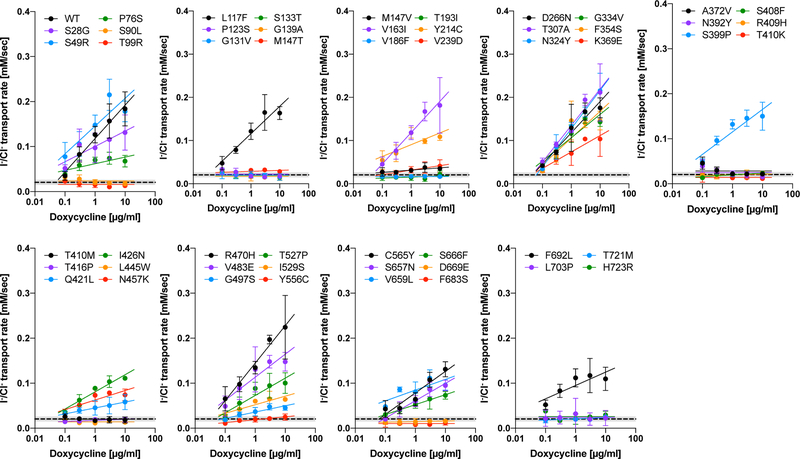
Figure 5.
A summary of I−/Cl− antiport assay. The initial transport rates were determined as shown in Figs. 4e and 4f, and plotted against doxycycline concentrations. The error bars indicate the standard deviations. The solid lines indicate linear regressions (log10 of doxycycline dosage vs. transport rate). The broken lines indicate the transport activity of non-induced cells (negative control). The numerical data used to generate these graphs are provided in Table 1.

