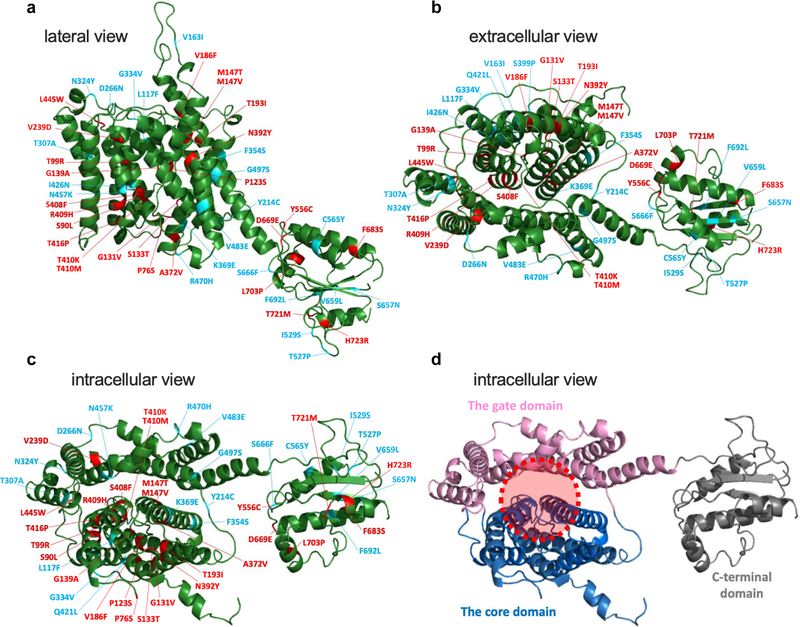
Figure 8.
A structural model of pendrin viewed from the lateral (a), extracellular (b), and intracellular (c and d) sides. This structural model was generated using Phyre2 (Kelley et al., 2015) based on the recently solved structure of murine SLC26A9 (Walter et al., 2019). Regions corresponding to Met1-Cys54, Val577-Pro654, and Val733-Ser780 are not shown, because they were not modeled with high confidence. In panels a-c, the locations of missense changes that result in > 80% reduction of HCO3−/Cl− antiport activity are indicated as red, while the others (≤ 80%) as blue. In panel d, the core, gate, and C-terminal cytosolic domains are shown in blue, pink, and gray, respectively. The broken red circle indicates the putative anion translocating pathway.

