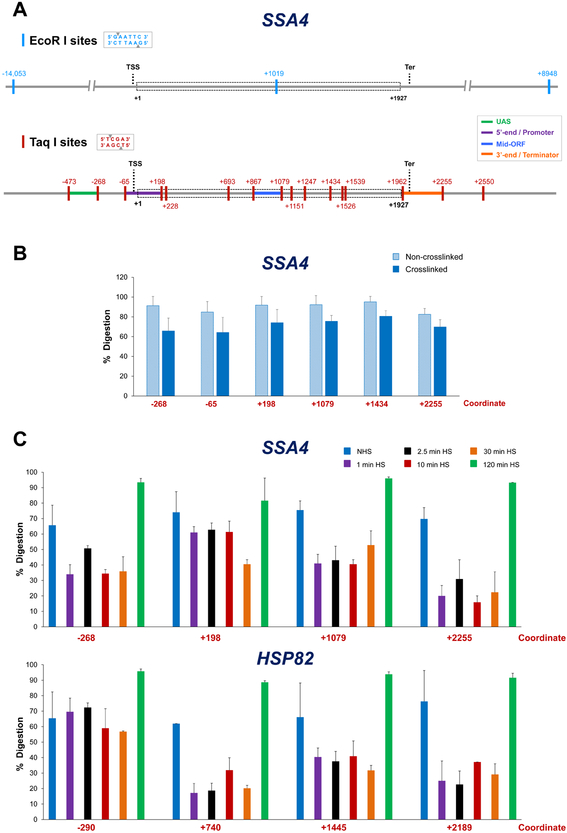
Figure 2. Distribution of restriction sites at a representative Pol II gene and cleavage efficiency under different crosslinking and physiological conditions.
A) EcoR I and Taq I restriction maps of SSA4. Depicted is the genomic locus encompassing the SSA4 open reading frame (ORF; dashed rectangle) and varying lengths of flanking sequence. Coordinates correspond to the location of restriction sites (vertical colored lines) and are numbered relative to the ATG initiation codon (+1); transcription start site (TSS) and termination site (Ter) are indicated. Top: distribution of EcoR I (6-bp cutter) recognition sites. Bottom: Taq I (4-bp cutter) distribution. UAS, 5’-end/Promoter, Mid-ORF and 3’-end/Terminator regions are color-coded as indicated. For additional examples, see Figure B.1A.
B) Percent digestion of representative Taq I sites within SSA4 using templates isolated from non-heat-shocked (NHS) cells that were crosslinked (or not) prior to restriction digestion. Depicted are means + SD; N=2, qPCR=4.
C) As above, except percent digestion of Taq I sites within SSA4 and HSP82 is shown for crosslinked templates isolated from NHS cells or cells subjected to heat shock (HS) for the times indicated.

