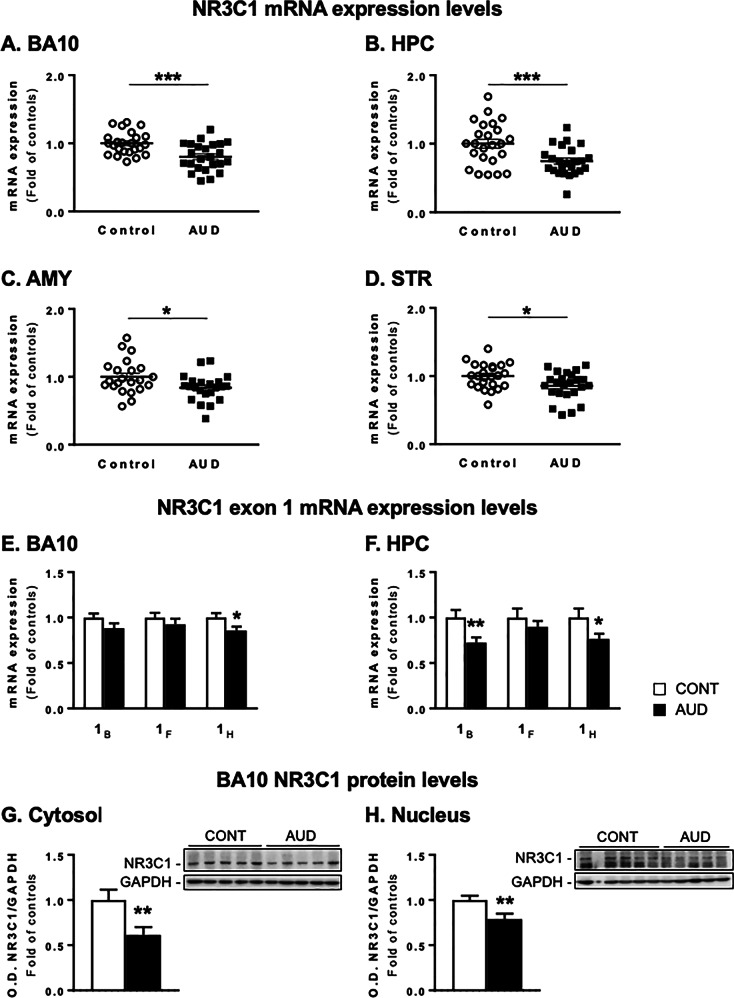
Fig. 3.
NR3C1 expression levels in alcohol use disorder (AUD) subjects. NR3C1 mRNA levels are expressed as fold change of controls in a prefrontal cortex (BA10, t1,46 = 3.75, p = 0.0005), b hippocampus (HPC, t1,46 = 3.28, p = 0.002), c amygdala (AMY, t1,46 = 2.39, p = 0.022), and d striatum (STR, t1,46 = 2.55, p = 0.014). NR3C1 exon 1B, F, and H are shown in e the BA10 (NR3C11H: t1,46 = 2.18, p = 0.034) and f the HPC (NR3C11B: t1,46 = 2.72, p = 0.009; NR3C11H: t1,46 = 2.08, p = 0.042). Protein levels of NR3C1 measured as a ratio of NR3C1/GAPDH optical density (O.D.) values in g cytosolic (t1,46 = 2.68, p = 0.010) and h nuclear (t1,46 = 2.79, p = 0.007) fractions are expressed as fold of controls. Representative western blots are shown on the right side. Values are mean ± SEM of 24 samples per group for mRNA levels and 25 samples per group for the protein analysis. *p < 0.05, **p < 0.01, Student’s t-test vs. controls

