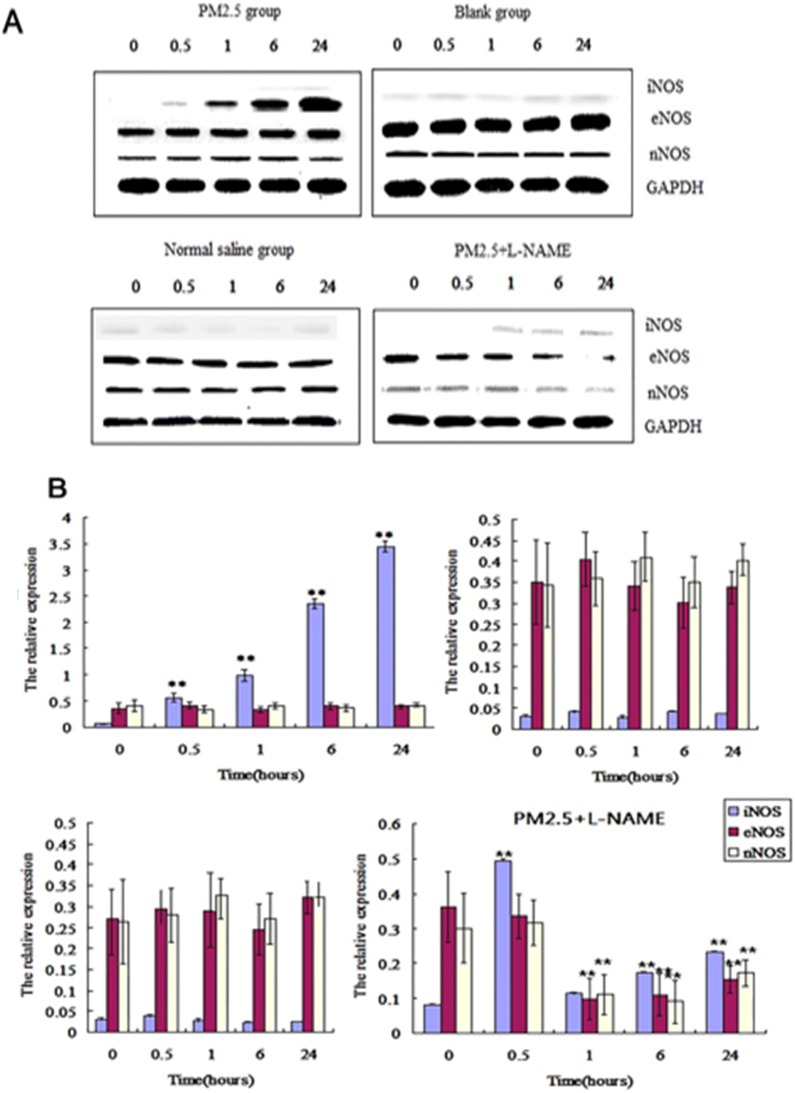
Figure 5.
The dynamic effects of single exposure to PM2.5 on NOSs in vessel. (A) Western blot analysis for the protein level of NOSs in vessel (n=4). (B)The qPCR assay showed the transcriptional level of NOSs in vessel (n=10).*P<0.05 compared with zero hour, **P< 0.01 and compared with the zero hour.

