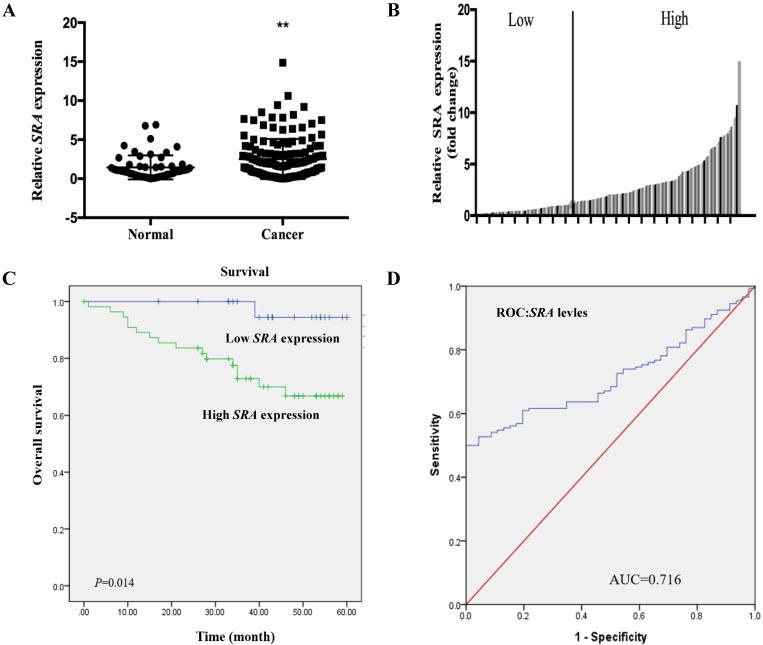
Figure 1.
SRA expression in human endometrial cancer patient tissues. (A) Relative expression of SRA was significantly higher in endometrial cancer (EC) patient tissues (n=146) than that in noncancerous patient tissues (n=57). SRA expression was determined using quantitative real time polymerase chain reaction with β-actin as an internal control. (B) SRA expression was classified into two groups according to the expression level of EC tissues. (C) Relative SRA expression and its clinical significance based on Kaplan-Meier overall survival curves of patients with endometrial cancer and different levels of SRA. (D) Receiver operating characteristic (ROC) curve for prognosis prediction of patients using SRA level. The area under curve (AUC) is shown in plots. Data are expressed as mean ± standard deviation. *p<0.05 vs. non-tumor control.

