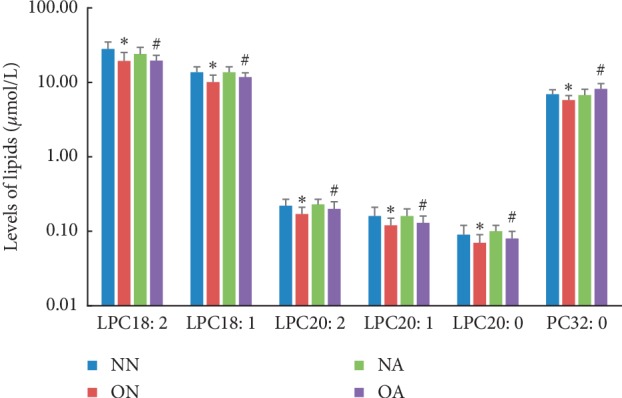
Figure 2.

Lipid concentrations differed significantly between normal-weight and obese adolescents with different clinical lipid levels. ∗ON vs. NN, P < 0.05; #OA vs. NA, P < 0.05. Abbreviations: NN, normal weight with traditional normal clinical plasma lipid levels; NA, normal weight with traditional abnormal clinical plasma lipid levels; ON, obese with traditional normal clinical plasma lipid levels; OA, obese with traditional abnormal clinical plasma lipid levels; LPC/PC x: y, (lyso) phosphatidylcholines with acyl chain length x and y double bonds.
