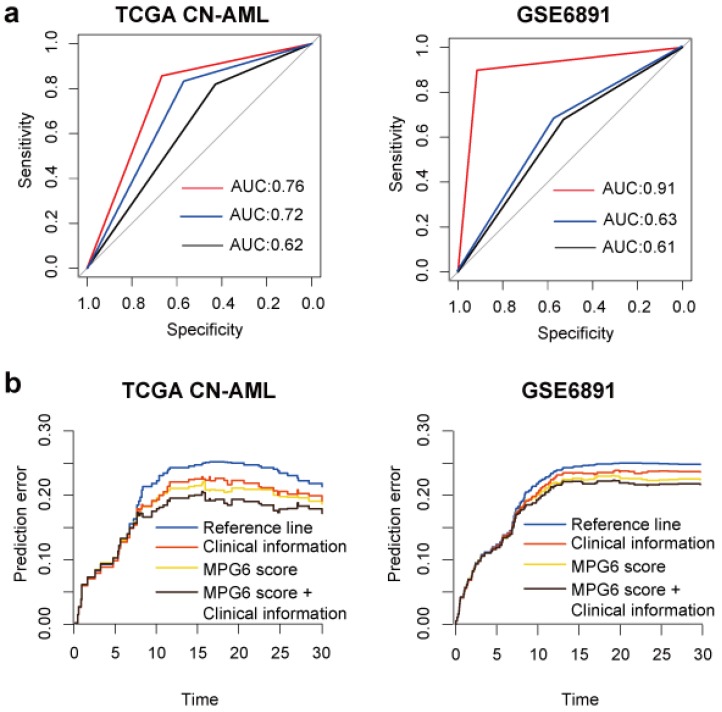
Figure 2.
The MPG6 score can improve the performance to predict survival. (a) ROC curve of logistic regression model in TCGA CN-AML and GSE6891 cohorts. The red line represents the ROC curve of combining MPG6 score with clinical information including age, WBC count, FLT3-ITD mutation and NPM1 mutation as features; the blue line represents ROC curve of using MPG6 score as the only feature in logistic regression model, and the black line represents ROC curve using clinical information mentioned above as features. (b) Prediction error curve of multivariate Cox regression model with or without MPG6 score. Reference line indicates Kaplan-Meier estimation without additional variables. Lower curve (lower prediction error) indicates better predictive value.

