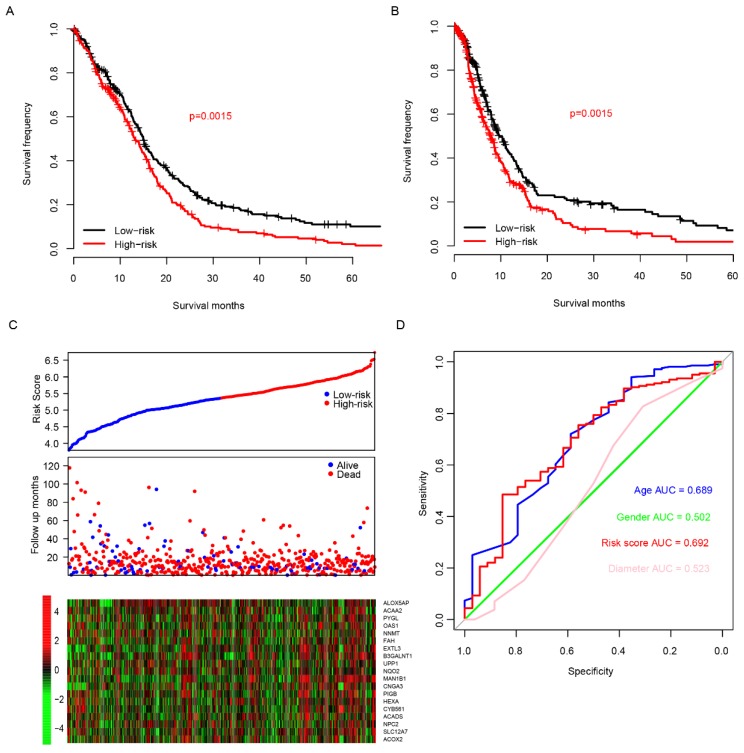
Fig 2.
Risk score in predicting survival. The high-risk group has a significantly longer overall survival (OS) time than low risk group (A), and it is also similar to progression free survival (PFS, B). Detailed survival information of samples, risk score and gene expression (each point represents a sample, C) and one-year survival ROC were also plotted (D).

