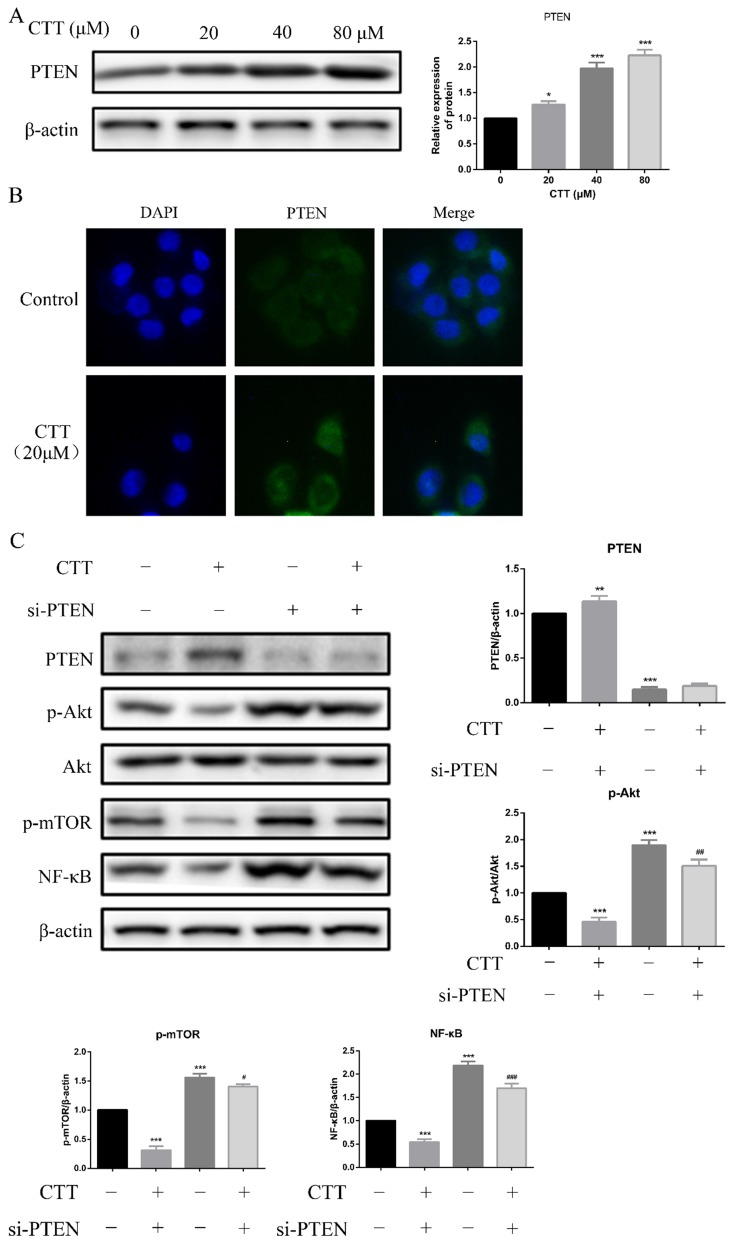
Figure 5.
CTT upregulated PTEN expression in vitro. (A) Images of protein expression of PTEN was detected by Western blotting. (B) Representative immunofluorescence image images of expression of PTEN were evaluated at 0 and 24 h (× 200). (C) 5637 cells were treated with CTT in presence or absence of the PTEN-siRNA, followed by Western blot analysis of the expression of PTEN, p-Akt, p-mTOR and NF-κB proteins. The results were shown as the mean ± SD of three experiments. * P < 0.05, ** P < 0.01, *** P < 0.001, compared with control group.

