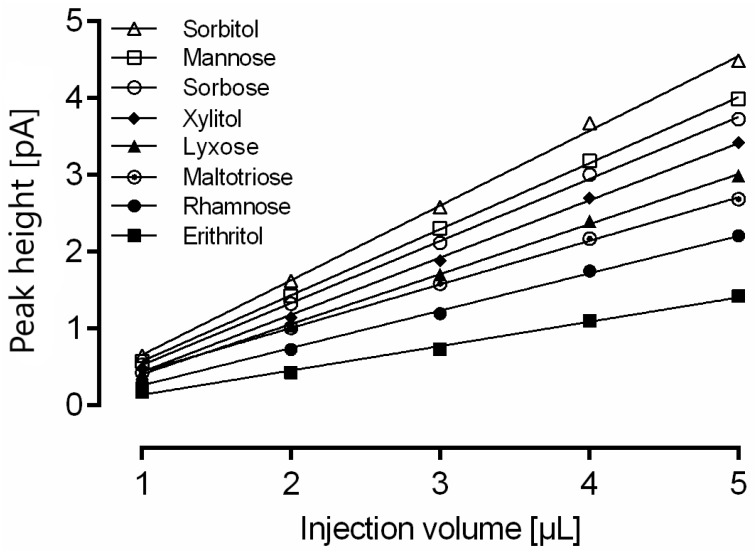
Figure 2.
Impact of injection volume on calculated amount of rhamnose, erythritol, lyxose, xylitol, sorbose, mannose, sorbitol and maltotriose measured with optimized gradient conditions. For a clear representation, linear regression is only shown for eight representative analytes. Data are the average of five determinations.

