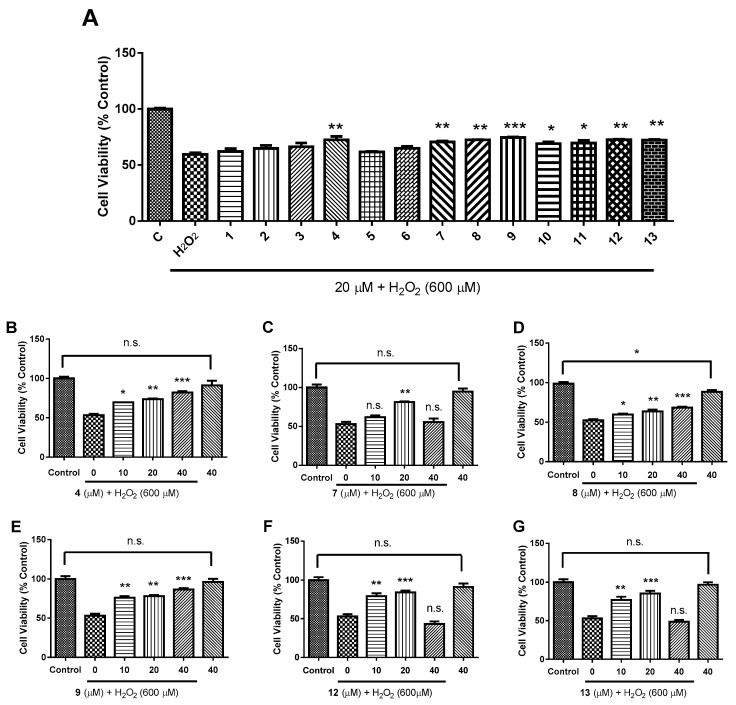
Figure 6.
Neuroprotective activities of compounds 1−13 against H2O2-mediated oxidative stress in HT-22 cells. Cell viability was determined by CCK-8 assay. (A): Primary screening at 20 μM; (B–G): Dose-dependent curve of 4, 7–9, 12, and 13. Control was PBS-treated cells. “40” in bar charts means that cells were only treated by 40 μM compound. n = 3, all data in bar charts represent means ± SEM. The symbol n.s. means no significance, * p < 0.05, ** p < 0.01, *** p < 0.001, one-way ANOVA with post-hoc comparison Turkey.

