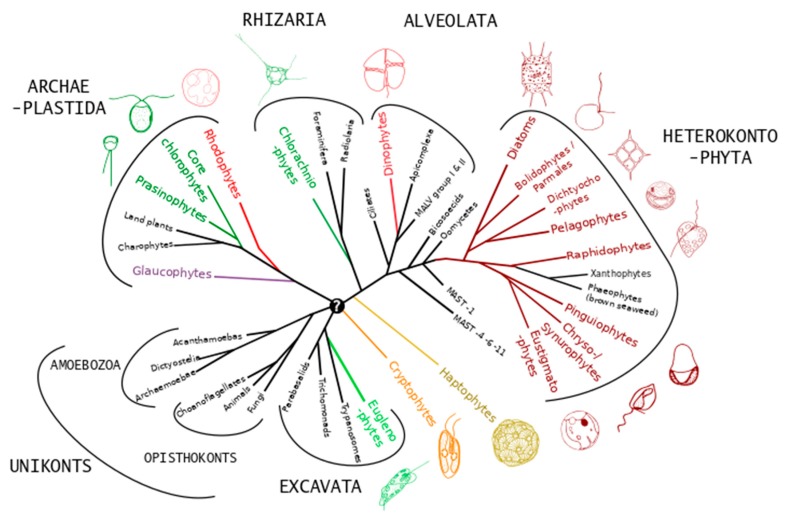
Figure 2.
Schematic phylogenetic tree representing the distribution of microalgae (colored lineages with representative images) across major eukaryote supergroups. Adapted with permission from Not et al., Advances in Botanical Research, 64, 1–53; published by Elsevier, 2012 [17].

