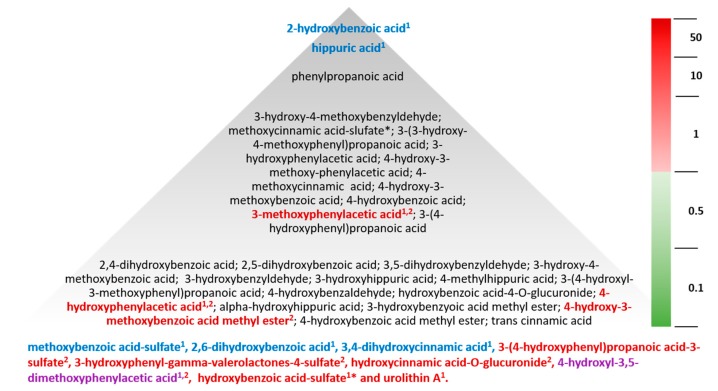
Figure 6.
Abundance of human metabolites following consumption of blueberries and strawberries. Values reflect maximum concentration reported in a single serum/plasma sample within the blueberry [4] or strawberry intervention dataset. Bold, metabolites found to change significantly; blue, metabolites changing significantly (p < 0.05) following feeding with blueberry; red, metabolites changing significantly (p < 0.05) following feeding with strawberry; purple, metabolites changing significantly (p < 0.05) following feeding with blueberry or strawberry. Superscripts: 1 significant treatment/intervention effect; 2 significant within treatment group effect for change relative to baseline concentration; *unknown isomeric configuration as a result of co-eluting peaks or lack of reference standard.

