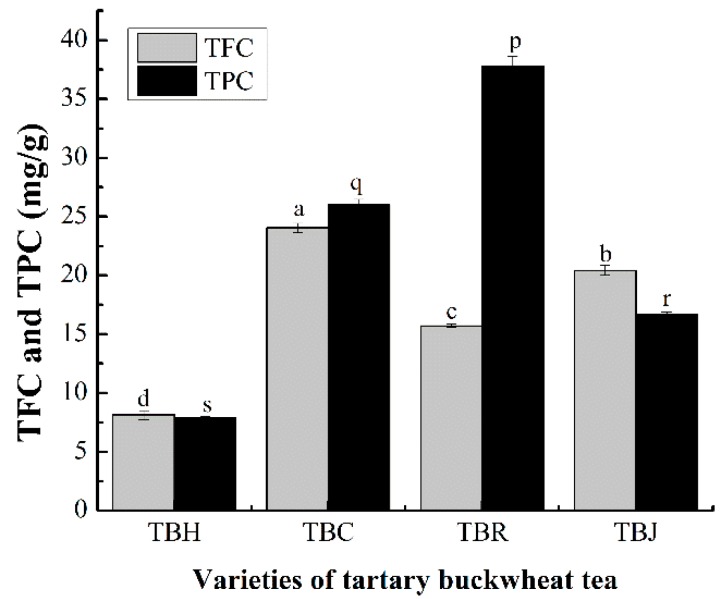
Figure 5.
The total flavonoid content (TFC) and total phenolic content (TPC) in tartary buckwheat tea (TBT) (The same letter in the Figures signifies no significant difference, and the letters a–d and p–s indicates the difference of the total flavonoid content (TFC) and total phenolic content (TPC), respectively (p < 0.05)).

