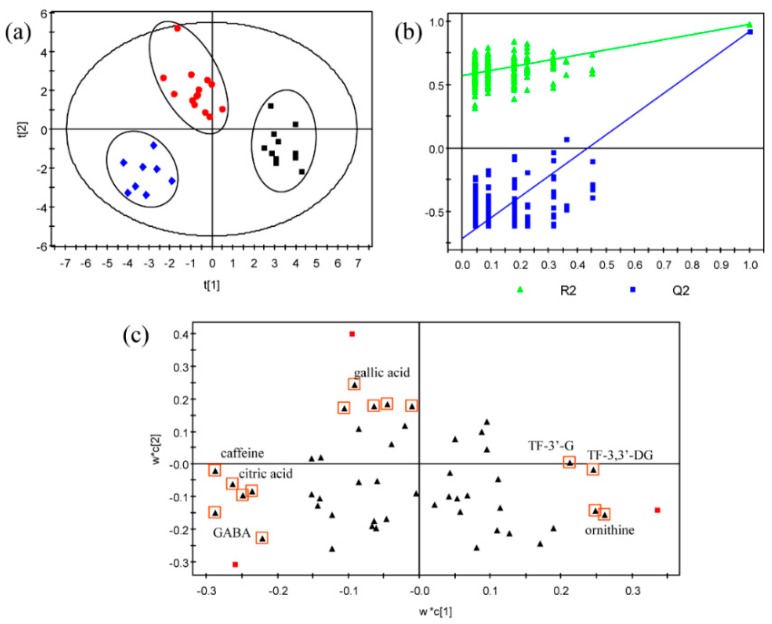
Figure 1.
An overview of the chemical composition profiles of black tea infusions featured with the sweet-mellow, mellow-pure, and less-mellow taste quality revealed by partial least square–discriminate analysis (PLS-DA) after orthogonal signal correction (OSC) data filtering. (a) Score scatter plot of tea infusion profile composed of quantified taste-active compounds after unit variance (uv) scaling. Black box, red dot, and blue squares represent tea infusions rendering the sweet-mellow, mellow-pure, and less-mellow taste quality, respectively. (b) Cross-validation of the PLS–DA model by 200 permutations. (c) Loading plot. Black triangles represent all variables and those highlighted with red box indicate compounds that might significantly contribute to group separation. TF-3′-G, theaflavin-3′-gallate; TF-3,3′-DG, theaflavin-3,3′-digallate; GABA,γ-aminobutyric acid.

