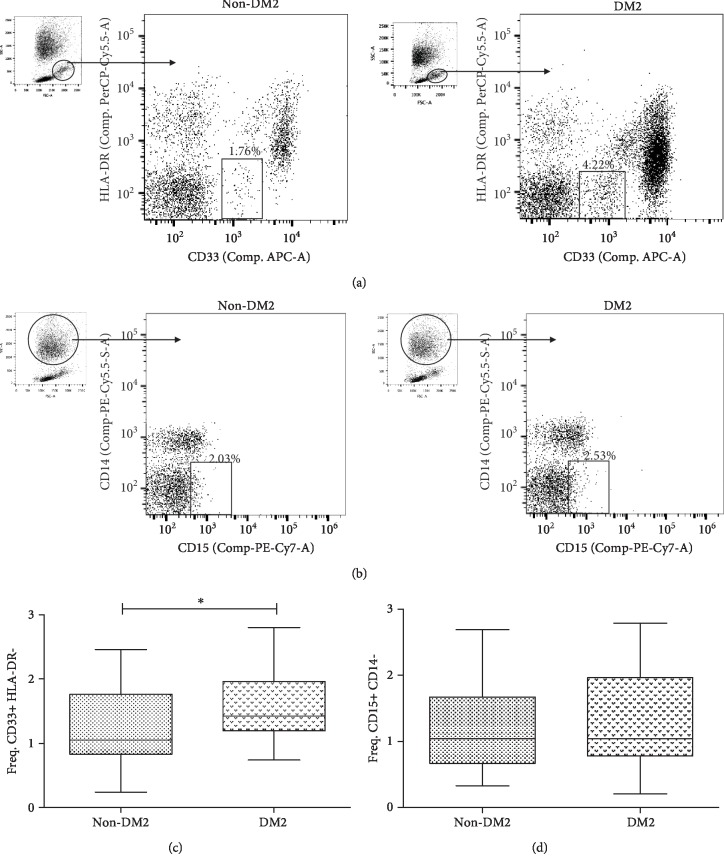
Figure 1.
Gating strategy and frequencies of MDSCs in DM2. (a) Dotplot APC vs. PerCP-Cy5.5 shows PBMCs and the gate mark of the CD33+ HLA-DR-/low MDSCs. (b) Dotplot PE-Cy7 vs. PE-Cy5 shows PBMCs and PMNs and the gate mark of the CD15+ CD14- MDSCs. (c) Frequency of CD33+ HLA-DR-/low MDSCs, comparing the group of DM2 (n = 22) with the non-DM2 group (n = 21). The graph shows the median with interquartile ranges. (d) Frequency of CD15+ CD14- MDSCs, comparing the group of DM2 (n = 20) with the non-DM2 group (n = 21). The graph shows the mean and standard deviation. A P value < 0.05 was considered as statistically significant which was calculated using the statistical test of Mann-Whitney. Statistical analysis was performed with the GraphPad Prism® v5.0 software. Data were obtained in a BD FACSCanto II® Flow Cytometer and were analyzed with the software FlowJo® v10.0.

